Performance Analytics provides insights into the performance of G2-driven LinkedIn campaigns and G2-influenced HubSpot deals, enabling you to measure the return on investment from G2 Buyer Intent data.

Basics of Performance Analytics
Performance Analytics organizes insights into three tabs:
LinkedIn measures the impact of G2-built audience segments on campaign conversions, leads, and spend efficiency.
HubSpot (Buyer Intent influence on deals) shows how G2 Buyer Intent data influenced your deals, pipeline, and revenue.
HubSpot (Measuring ROI with G2 activity) highlights how much of your pipeline is on G2 and the value of maintaining your G2 presence.
Salesforce shows the impact of Buyer Intent signals on your Salesforce opportunities and revenue.
To access the Performance Analytics tab, go to my.G2, then ROI > Performance Analytics.
About G2 Buyer Intent data
G2 Buyer Intent captures enriched data about buyers researching your product across G2. Buyer Intent signals can be generated by a variety of buyer actions, including interacting with your G2 product profile page, comparing your product to a competitor, and viewing alternatives for a product in a shared category. This data enables your sales, marketing, and customer success teams to identify a buyer's stage in the buyer journey.
G2 Buyer Intent data is captured at the company level, and is not linked to individual people.
Refer to the Buyer Intent documentation for more information on signal types, reviewing which signals are included in your subscription, and more.
Enable data sharing in G2
G2 recommends enabling data sharing so you can understand the impact of G2 Buyer Intent data on your sales and marketing efforts.
You must re-authenticate your HubSpot, LinkedIn, and Salesforce integrations to enable G2 to access additional data.
In Salesforce, re-authentication must be done by a Salesforce admin. In HubSpot, re-authentication must be done by someone with access to deal data.

To update the permissions for each integration, navigate to the HubSpot, LinkedIn Matched Audiences and Salesforce integration tiles.
Once data sharing is enabled, data will be available within 24 hours in the Performance Analytics dashboard. If you deactivate Performance Analytics, your data is deleted within 15 days.
If you prefer not to share your HubSpot data with G2, you can disable this setting using the Allow G2 to pull deals data to enable Performance Analytics slider in the HubSpot integration tile.

How G2 defines an influenced deal
A HubSpot or Salesforce deal is considered influenced by G2 when Buyer Intent activity is matched to the company associated with that deal.
A deal is only counted as influenced if Buyer Intent activity happened recently and before the deal closed. Specifically:
A G2 signal must occur within 180 days before the deal’s Created Date, OR
Within 180 days before or after the deal’s last Updated Date,
AND the signal must always occur before the deal’s Close Date.
This ensures that only recent G2 activity is counted when determining which deals are influenced.
The LinkedIn tab shows how your LinkedIn campaigns perform when they use G2 Buyer Intent audience segments built from buyer activity on G2.
G2 uses LinkedIn’s Reporting & ROI API to obtain ad performance data.
To access the Performance Analytics tab, go to my.G2, then ROI > Linkedin.
The Performance of G2 + LinkedIn Campaigns panel shows the conversions and leads generated from LinkedIn campaigns built with Buyer Intent audience segments, along with average cost per conversion and lead based on total campaign spend.

The Campaigns Found with G2 Built Audience table lists the LinkedIn campaigns that used Buyer Intent audience segments built from buyer activity on G2.
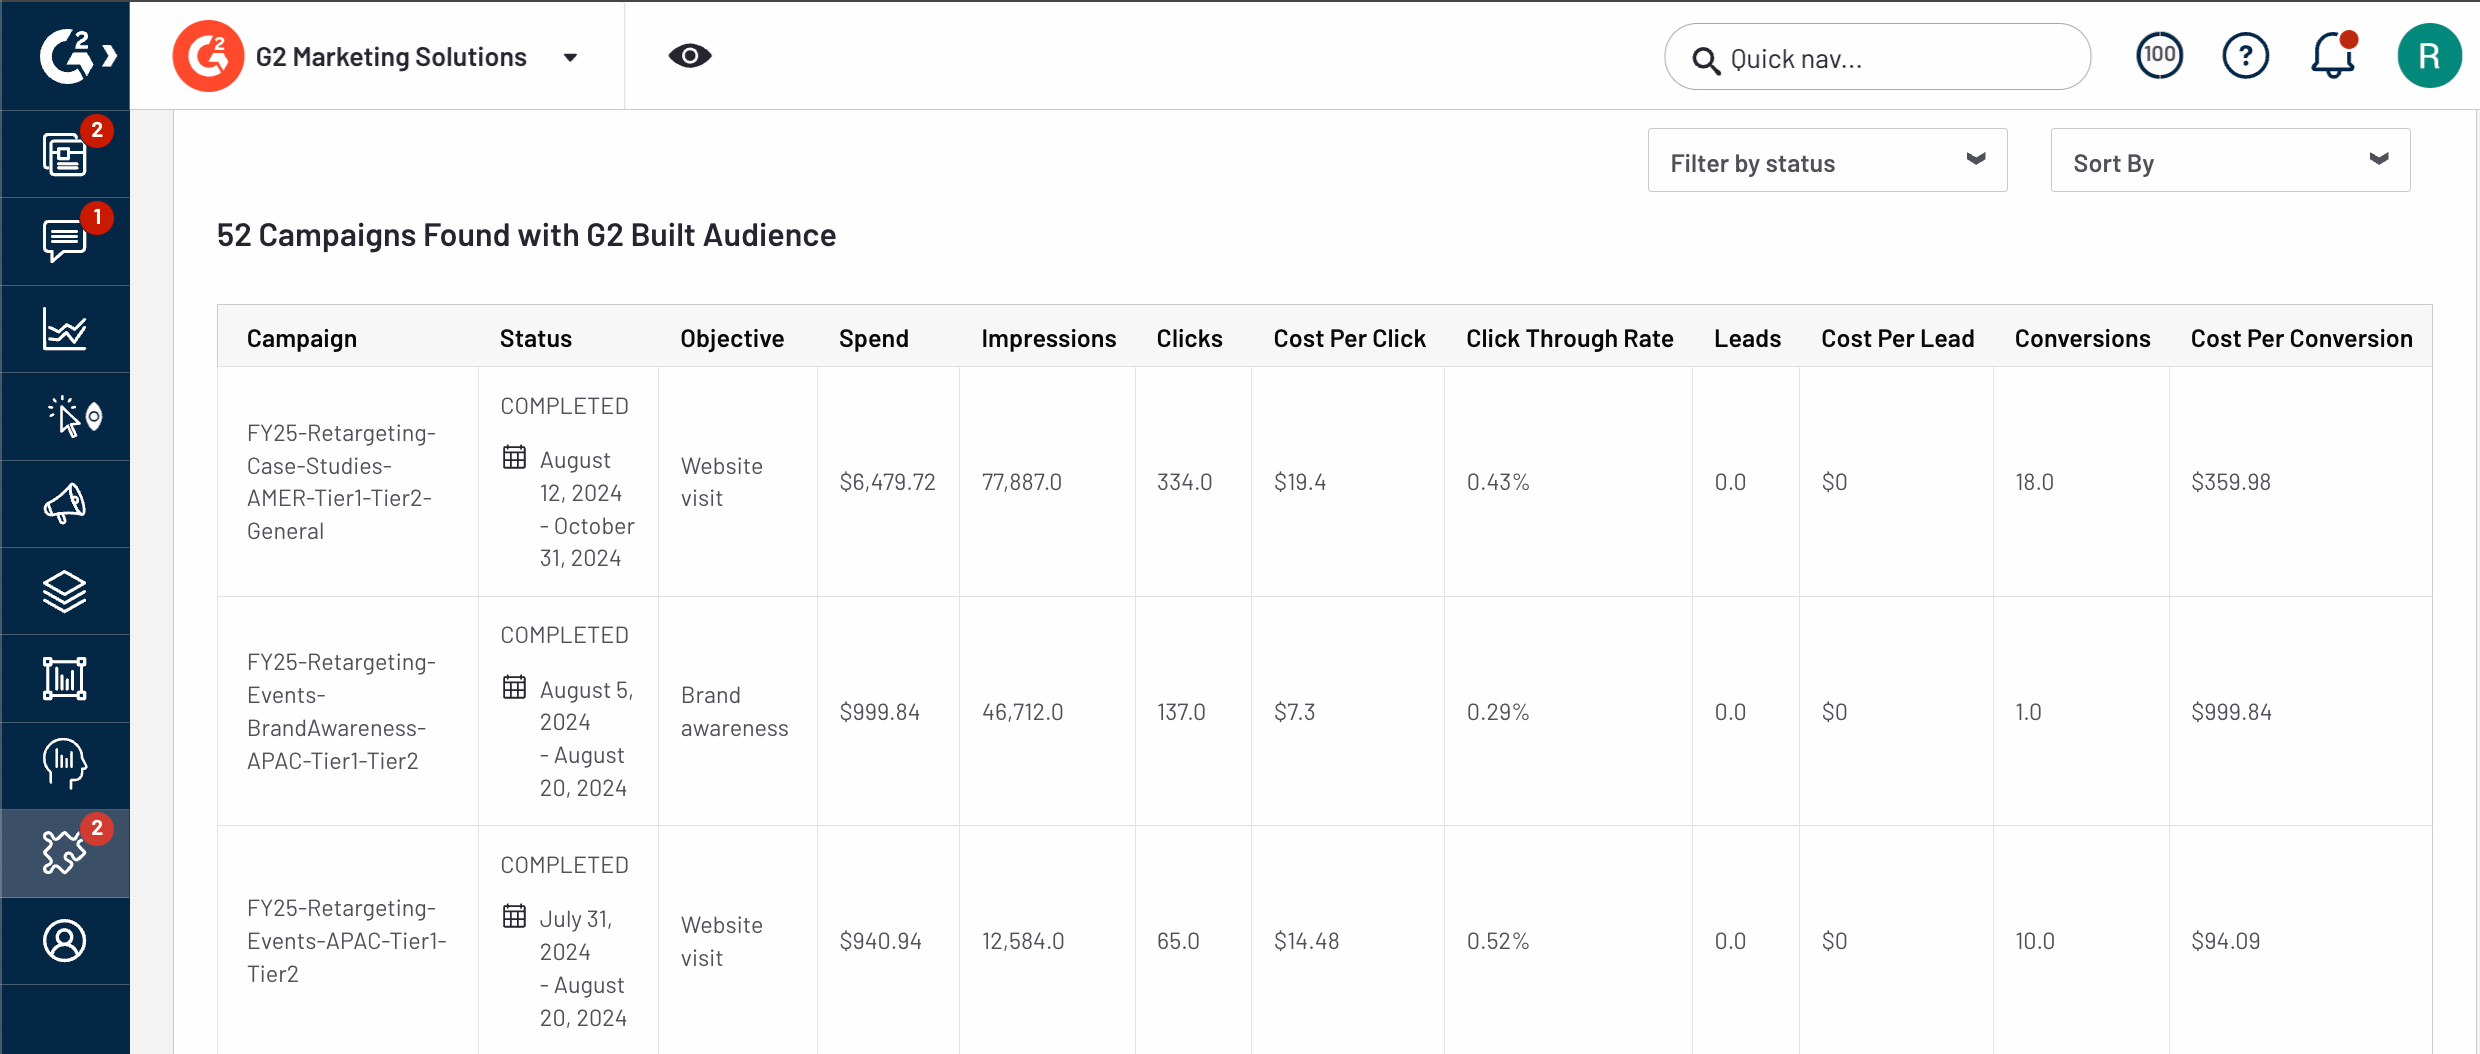
The table includes the following campaign metrics:
| Metric | Description |
|---|---|
| Objective | The primary goal of the campaign, such as driving brand awareness, generating leads, or increasing conversions. |
| Spend | The total amount of money spent on the campaign over its duration. |
| Impressions | The number of times the campaign's ads were displayed to users, regardless of whether they engaged with the ad. |
| Clicks | The number of times users clicked on the campaign's ads. |
| Cost Per Click | The average amount spent each time someone clicks on an ad. |
| Click Through Rate | The percentage of impressions that resulted in a click. |
| Leads | The number of potential customers who provided contact information or took an action that indicates interest in the product or service. |
| Cost Per Lead | The average amount spent to generate each lead. |
| Conversions | The number of users who completed a desired action (e.g., purchase, sign-up) as a result of the campaign. |
| Cost Per Conversion | The average cost to generate each conversion. |
The Campaigns Found without G2 Built Audience table lists the LinkedIn campaigns that did not use Buyer Intent audience segments.

HubSpot
The HubSpot tab provides a detailed view of how G2 Buyer Intent data influenced your HubSpot deals in the past year.
The HubSpot Performance Analytics dashboard differs by subscription:
Buyer Intent dashboard: For subscriptions that include Buyer Intent, the HubSpot tab surfaces insights into how Buyer Intent signals influence your deals.
ROI dashboard (no Buyer Intent): For subscriptions without Buyer Intent, the HubSpot tab provides an ROI dashboard to measure the value of your G2 presence.
To access the Performance Analytics tab, go to my.G2, then ROI > HubSpot.
Filtering Performance Analytics data
By default, G2 displays data for the past year. To adjust the time interval, select one of the default options.

Select Settings to open additional configuration options, including Set Field Mapping, Hide Outlier Data, and Remove Authentication.
.png?sv=2026-02-06&spr=https&st=2026-07-16T07%3A42%3A06Z&se=2026-07-16T08%3A06%3A06Z&sr=c&sp=r&sig=%2FZ0RR8eyLKYoSEsmgbHeZDIZYWDhaGZxia8otJNmJOA%3D)
You can map your HubSpot fields so ROI metrics reflect the way you track deals. This includes choosing the default Currency, Closed Won Deal Stages, In Progress Deal Stages, or Closed Lost Deal Stages. To configure your fields, select Field Mapping.

Select Hide Outlier Data to exclude unusually large, zero-value, or structurally invalid deals from ROI calculations.

You can re-enable outlier data at any time.
Hidden deals remain visible in the outlier review pane, where you can review and restore individual records.
Select Remove Authentication to disconnect your integration from Performance Analytics. This stops additional data syncing and removes CRM-based ROI reporting from your dashboard.

To resume reporting, reauthenticate your integration.
AI Insights and Recommendations
The AI summary panel provides AI-generated insights that help you understand ROI performance for the selected date range. It highlights trends in influenced revenue, deal size, win rate, sales cycle, and high-intent activity based on your CRM opportunity data and associated G2 Buyer Intent signals.

G2 generates these summaries dynamically from the ROI data in your dashboard and updates them as your underlying CRM or CSV-based data changes. Use AI-generated insights as a starting point for deeper analysis of ROI charts and metrics throughout the dashboard.
Buyer Intent influence on deals
The HubSpot Performance Analytics dashboard shows how G2 Buyer Intent signals influence your deals and revenue. This dashboard shows how Buyer Intent activity aligns with your deal stages, closed-won revenue, and new accounts created by G2.

G2 accesses and stores the following objects from HubSpot:
| Object | How it’s used |
|---|---|
| Company | Connects contacts and deals to the right account domain for Buyer Intent matching. |
| Deal | Provides value, stage, and close information for pipeline and revenue metrics. |
| Forms | Captures inbound submissions related to G2-influenced activity. |
| Engagements | Includes activities (emails, calls, meetings) tied to influenced deals. |
| Lists | Enables segmentation and matching for reporting. |
The Deals Influenced by Stage graph shows how many G2 Buyer Intent signals matched to companies in your HubSpot instance and the impact of G2 Intent on your Deals.

You can hover over each segment in the funnel to reveal more information, such as the Total G2 Buyer Intent Signals, G2 signals matched to existing companies, and Companies created by G2.
You can enable G2 to create new accounts in your HubSpot environment to maximize buyer intent matches.

The Total Closed Won Dollars By G2 chart highlights the value of closed won deals that were influenced by G2's Buyer Intent data.
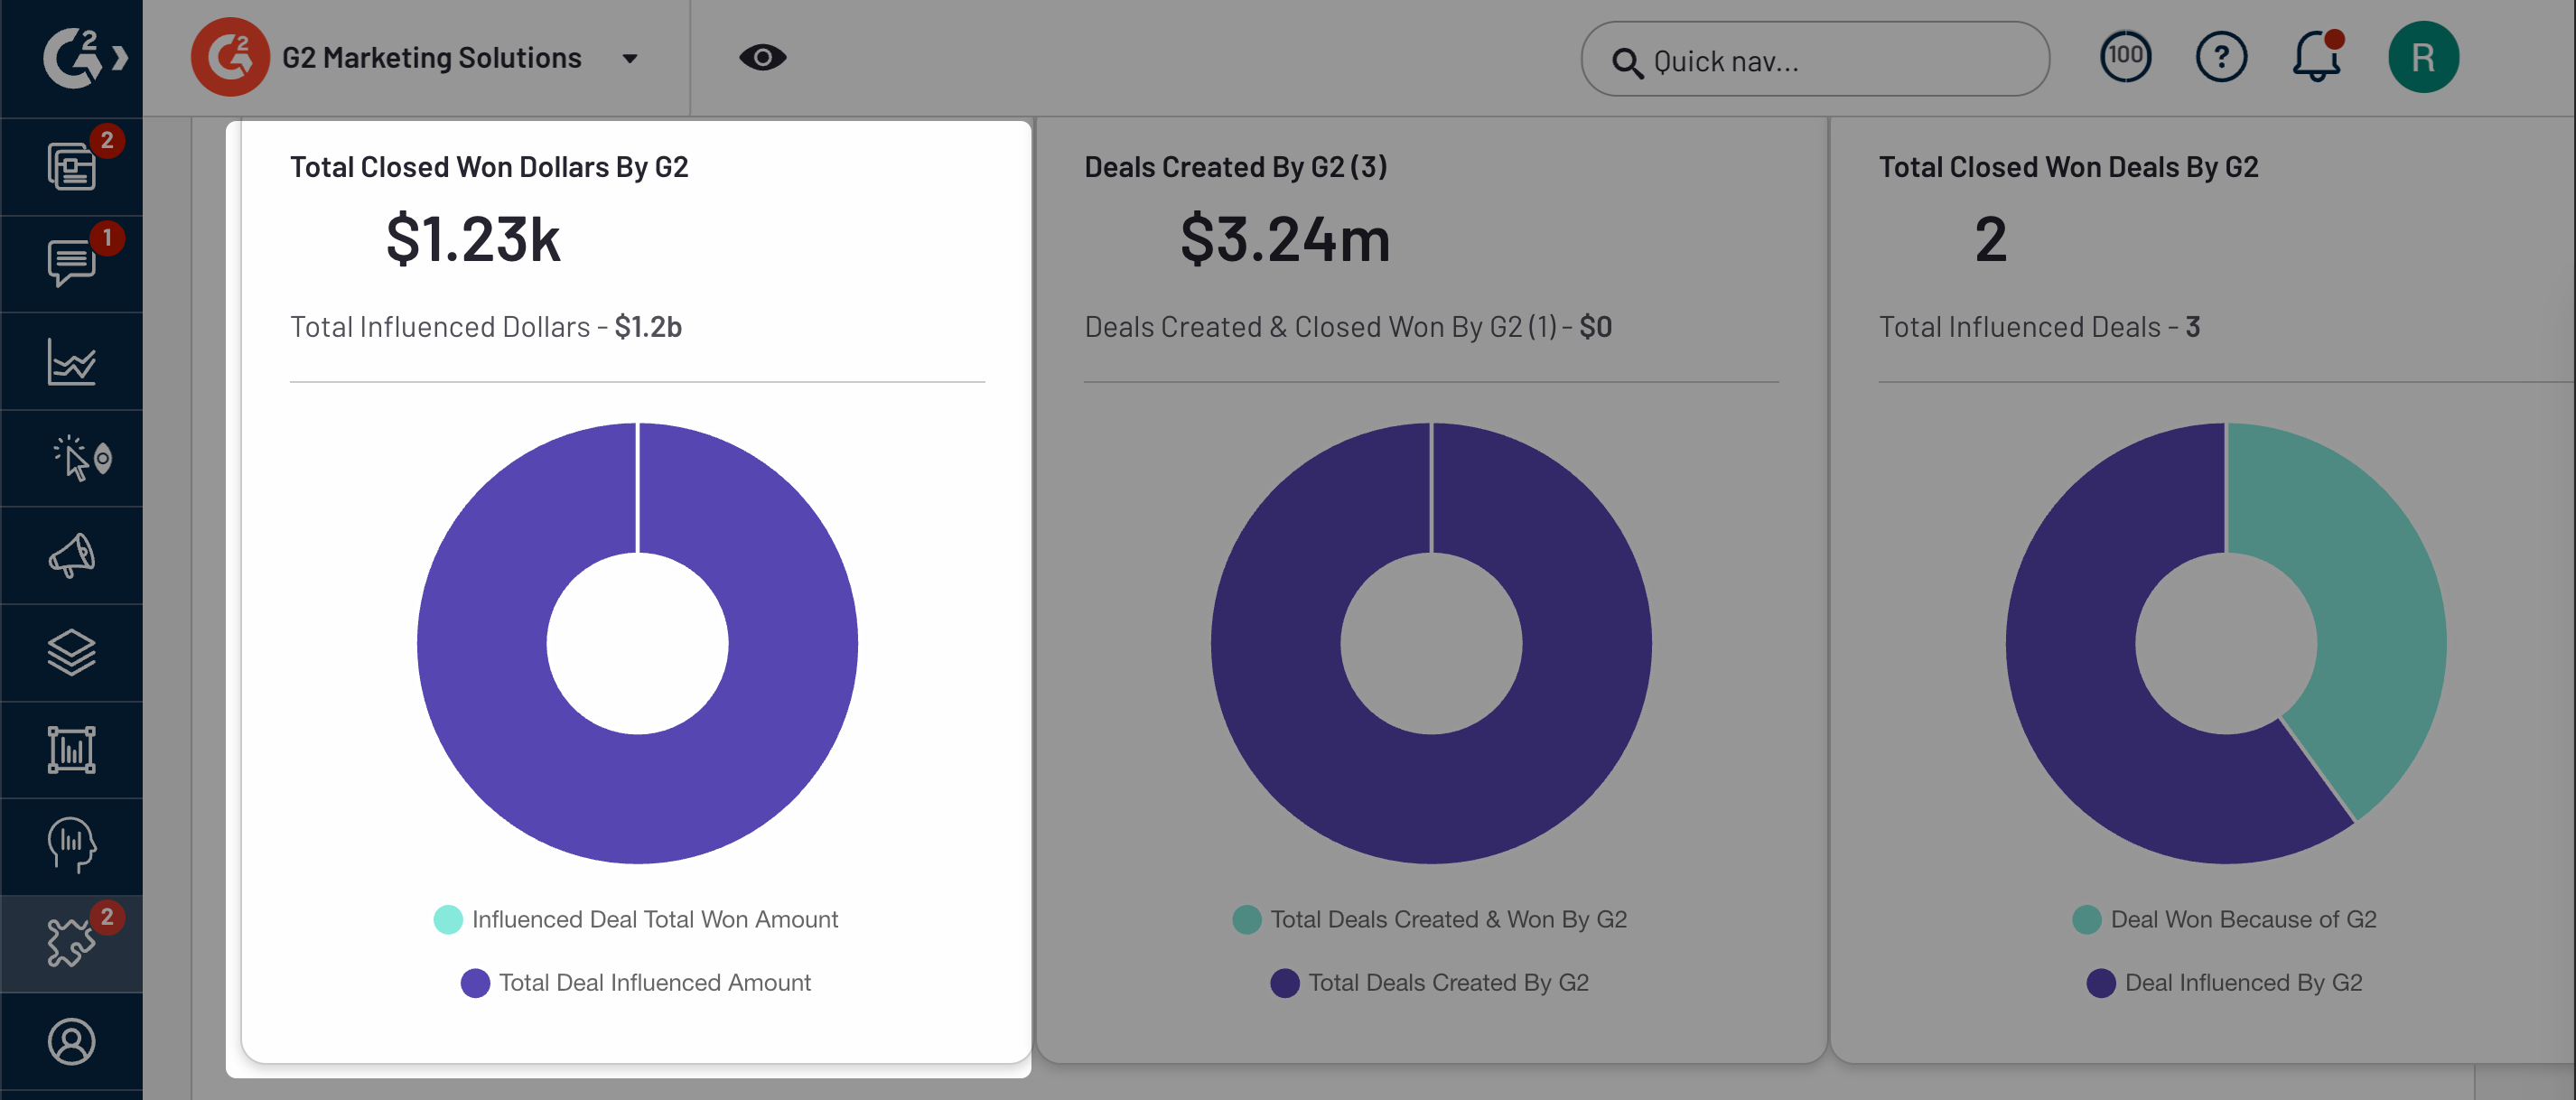
A deal is considered Influenced when G2 data is associated with an account that already exists in your HubSpot instance. For more information, refer to the How G2 defines an influenced deal section.
The Deals Created By G2 chart shows the total deals created by G2 and the value of deals from G2-created accounts.

A deal is considered Created by G2 when G2 creates a new company in your HubSpot instance, resulting in a new deal or closed won revenue.
The Total Closed Won Deals By G2 chart shows the total number of closed won deals that had G2 Buyer Intent data associated with them and the number of deals influenced by G2 intent data.

Churn Threats
Churn Threats helps you identify HubSpot accounts that are researching your competitors on G2. G2 maps your HubSpot account domains to G2 activity, including competitive comparisons, category exploration, and profile views.

The table displays the Account Name, Churn Signal Type, Risk Level, Competitor Viewed, Last Seen, and the associated deal amount.
Measuring ROI with G2 activity
The HubSpot Performance Analytics dashboard dashboard compares closed-won deals from companies that engaged with your G2 profile to those that did not, showing the overall revenue impact of G2.
This dashboard is available if your subscription does not include Buyer Intent data. To access it, you must integrate HubSpot and maintain an active G2 profile.

The G2 Deal Impact Metrics panel contains the following metrics:
| Metric | Description | HubSpot objects |
|---|---|---|
| G2 Influenced Dollars | The total dollar value of all HubSpot deals influenced by G2 Buyer Intent data. Use this to measure the overall revenue impact of buyer activity on G2 on your deals. :::(Info) For details on how G2 determines if a deal is considered influenced, refer to the How G2 defines an influenced deal section. ::: |
Deal, Company |
| High Intent Influenced Pipeline | The total dollar value of HubSpot deals influenced by high-intent G2 Buyer Intent signals. You can evaluate whether high-intent signals correlate with more valuable deals. |
Deal, Company |
| G2 Influenced Closed Won Dollars | The total dollar value of G2-influenced HubSpot deals that closed as won. You can compare this against overall closed-won revenue to understand G2’s contribution. |
Deal, Company |
| Influenced Closed Won Pipeline, High Intent | The total dollar value of closed-won HubSpot deals influenced by high-intent G2 signals. You can understand the revenue impact specifically tied to high-intent activity. |
Deal, Company |
| Average Influenced Deal Size | The average value of G2-influenced deals, calculated by dividing the total influenced pipeline value by the total number of influenced deals. You can benchmark this against your overall average deal size to understand how G2 deals compare. |
Deal, Company |
| Influenced Deal Close Rate | The percentage of G2-influenced deals that closed, calculated by dividing closed-won deals by total influenced deals. You can assess whether G2-influenced deals are more likely to close compared to non-G2 deals. |
Deal |
| Influenced Sales Cycle Length | The average number of days between deal creation and deal close for G2-influenced deals. You can use this to determine if G2-influenced deals progress faster through your sales cycle. |
Deal |
G2 checks for overlap between your HubSpot deals and companies that researched products, compared vendors, or explored categories on G2 in the past year.

The G2 Deal Influence chart shows the number of deals associated with companies that engaged with your G2 profile, including how many closed.

The G2 Revenue Influence chart shows the total closed-won revenue from G2-influenced deals, highlighting the impact of buyer activity on G2 on your overall revenue.

Salesforce
The Salesforce tab shows how Buyer Intent signals impact your Salesforce opportunities and closed-won revenue.

To access the Performance Analytics tab, go to my.G2, then ROI > Salesforce.
Filtering Performance Analytics data
By default, G2 displays data for the past year. To adjust your time interval, select one of the default options.

Select Settings to open additional configuration options, including Set Field Mapping, Hide Outlier Data, and Remove Authentication.
You can map your Salesforce fields so ROI metrics reflect the way you track deals. This includes choosing the default Currency, Closed Won Deal Stages, In Progress Deal Stages, or Closed Lost Deal Stages. To configure your fields, select Field Mapping.
Select Hide Outlier Data to exclude unusually large, zero-value, or structurally invalid deals from ROI calculations.
You can re-enable outlier data at any time.
Hidden deals remain visible in the outlier review pane, where you can review and restore individual records.
Select Remove Authentication to disconnect your integration from Performance Analytics. This stops additional data syncing and removes CRM-based ROI reporting from your dashboard.

To resume reporting, reauthenticate your integration.
AI Insights and Recommendations
The AI summary panel provides AI-generated insights that help you understand ROI performance for the selected date range. It highlights trends in influenced revenue, deal size, win rate, sales cycle, and high-intent activity based on your CRM opportunity data and associated G2 Buyer Intent signals.
G2 generates these summaries dynamically from the ROI data in your dashboard and updates them as your underlying CRM or CSV-based data changes. Use AI-generated insights as a starting point for deeper analysis of ROI charts and metrics throughout the dashboard.
G2 Opportunity Impact Metrics
The G2 Deal Impact Metrics panel shows aggregated values for opportunities influenced by Buyer Intent.
The following Salesforce fields are used to calculate the metrics displayed in this dashboard:
Amount, Name, CreatedDate, CloseDate, StageName, Probability, Account.Name, Account.Website, LeadSource.
The G2 Opportunity Impact Metrics panel contains the following metrics:
| Metric | Description | Salesforce fields |
|---|---|---|
| G2 Influenced Dollars | The total dollar value of all Salesforce opportunities influenced by G2 Buyer Intent data. Use this to measure the overall revenue impact of buyer activity on G2 on your opportunities. :::(Info) For details on how G2 determines if an opportunity is considered influenced, refer to the How G2 defines an influenced deal section. ::: |
Amount, Stage Name, Account.Website |
| High Intent Influenced Pipeline | The total dollar value of Salesforce opportunities influenced by high-intent G2 Buyer Intent signals. You can evaluate whether high-intent signals correlate with more valuable opportunities. |
Amount, Account.Website |
| G2 Influenced Closed Won Dollars | The total dollar value of G2-influenced opportunities that closed as won. You can compare this against overall closed-won revenue to understand G2’s contribution. |
StageName, Account.Website |
| Influenced Closed Won Pipeline, High Intent | The total dollar value of closed-won opportunities influenced by high-intent G2 signals. You can understand the revenue impact specifically tied to high-intent activity. |
Amount, Account.Website |
| Average Influenced Opp Size | The average value of G2-influenced opportunities, calculated by dividing the total influenced pipeline value by the total number of influenced opportunities. You can benchmark this against your overall average opportunity size to understand how G2 deals compare. |
Amount, Name |
| Influenced Opp Close Rate | The percentage of G2-influenced opportunities that closed, calculated by dividing closed-won opportunities by total influenced opportunities. You can assess whether G2-influenced opportunities are more likely to close compared to non-G2 opportunities. |
StageName, Probability |
| Influenced Sales Cycle Length | The average number of days between opportunity creation and opportunity close for G2-influenced opportunities. You can determine if G2-influenced opportunities progress faster through your sales cycle. |
CreatedDate, CloseDate |
The G2 Opportunity Influence chart shows the number of opportunities associated with companies that engaged with your G2 profile, including how many closed.

The G2 Revenue Influence chart shows the total closed-won revenue from G2-influenced opportunities, illustrating the impact of buyer activity on G2 on your sales outcomes.

Churn Threats
Churn Threats helps you identify Salesforce accounts that are researching your competitors on G2. G2 maps your Salesforce account domains to G2 activity, including competitive comparisons, category exploration, and profile views.
The table displays the Account Name, Churn Signal Type, Risk Level, Competitor Viewed, Last Seen, and the associated deal amount.
Custom Analytics
The Custom Analytics tab enables you to generate ROI insights without connecting a CRM. Upload a CSV export of your deals, and G2 maps your data to the required ROI fields to populate the ROI dashboard.

Your CSV file must include the fields listed below. The Domain field is required. All other fields are optional, but the dashboard may be incomplete if they are missing. Include as many fields as possible to ensure accurate ROI reporting.
| Field name | Description |
|---|---|
| Domain (Required) | Customer’s website domain. Use a clean domain such as example.com. |
| Deal Name (Optional) | Name or title of the deal. |
| Deal Stage (Optional) | Current stage of the deal in your sales process. |
| Created Date (Optional) | Date the deal was created. |
| Updated Date (Optional) | Most recent date the deal record was updated. |
| Closed Date (Optional) | Date the deal was closed as won or lost. |
| Deal Stage Probability (Optional) | Probability of closing the deal. |
| Amount (Optional) | Total value of the deal. |
| Currency (Optional) | Currency code used in the deal record (for example, USD or EUR). |
To upload a CSV file:
- Go to my.G2(https://my.g2.com/~/performance_analytics), then ROI > Custom Analytics.
- Select Upload CSV, then choose your CSV file and select Submit.
- Review the mapped fields and correct them if needed.
- Select Submit.
The dashboard begins processing your data after submission. Tiles may show no data during this stage. ROI insights typically appear within 24 hours.
To refresh or extend your dataset, open the Custom Analytics tab and select Upload new CSV.
