Salesforce dashboards enable you to visualize key metrics and insights using data from Salesforce reports. You can customize the layout, add components, and tailor dashboards to meet your needs.
Getting started with Salesforce dashboards
This article provides detailed guidance on creating, customizing, and maximizing the use of Salesforce dashboards, including instructions for both Salesforce Classic and Lightning.
Pre-built Salesforce dashboards
G2 ROI dashboard
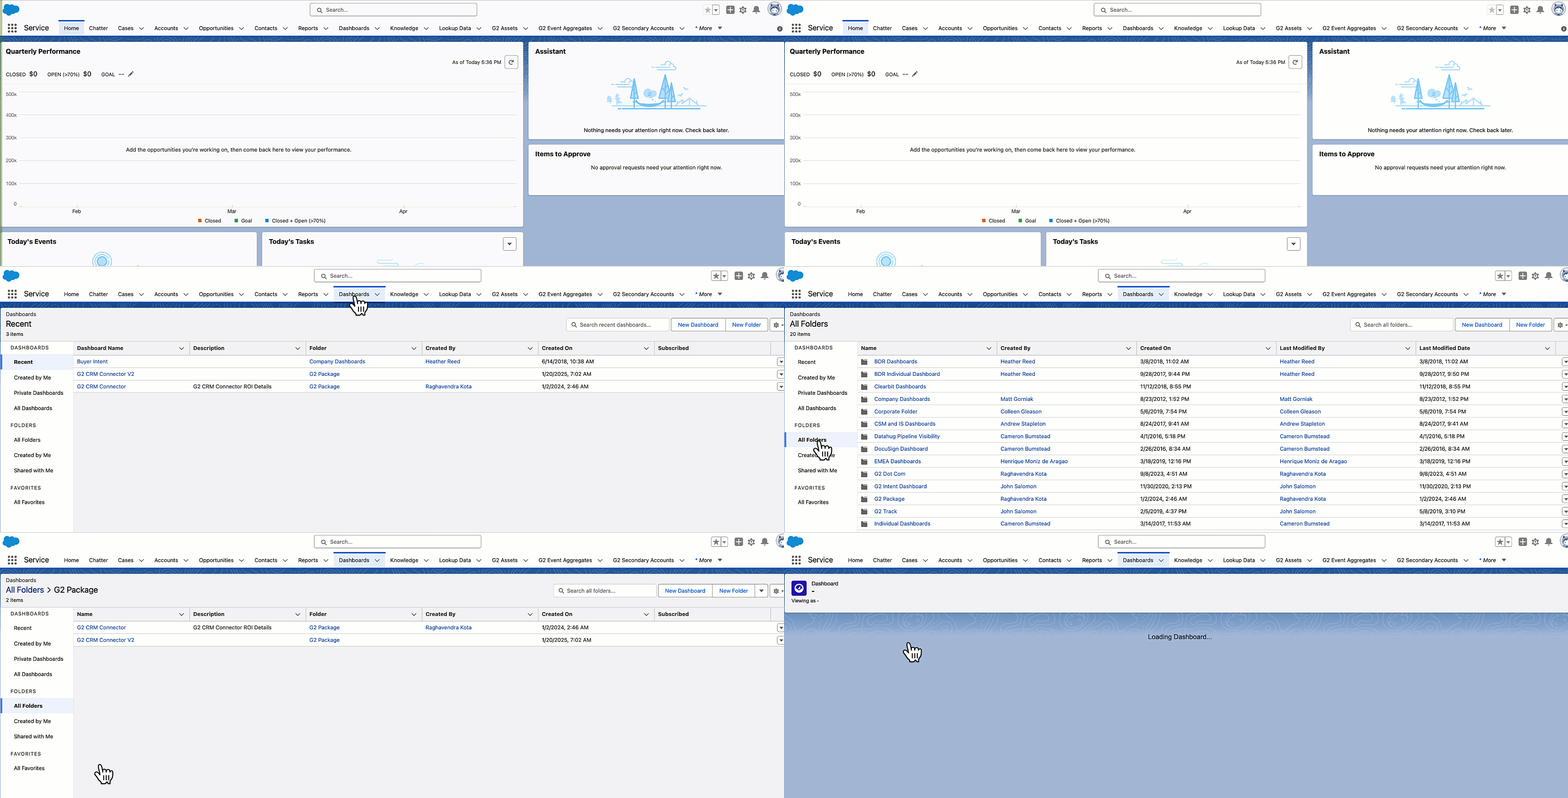
The G2 CRM Connector V2 dashboard is a pre-built solution that displays the ROI and influence of G2 Buyer Intent data on your opportunities. This embedded dashboard provides insights into influenced opportunities, closed-won deals, and account activity.

The dashboard includes the following reports:
| Report name | Description |
|---|---|
| G2 Buyer Intent Signal Volume | Number of Intent signals over a period of time. |
| Accounts by G2 Buying Stage and Activity | Shows the number of accounts in each buying stage and activity level. |
| G2 Influenced Opportunities by Stage | Maps Intent accounts to opportunity stages and displays total opportunity value in dollars. |
| G2 Buyer Intent Signals over Time | Tracks the count of each Intent signal type in Salesforce over time. |
To access the G2 ROI Dashboard:

- Log in to Salesforce, then select Dashboards.
- In the Dashboards panel select All Folders, then select G2 Package.
- Select the G2 CRM Connector V2 dashboard.
Creating Salesforce dashboards
Not all Salesforce reports are eligible to be included in a dashboard component. If a report is incompatible, Salesforce provides an error message detailing the required changes.
Salesforce Lightning instructions
- Go to the Dashboards app and select New Dashboard.
- In the New Dashboard pop-up, enter the following information:
- Name: Enter a name for the dashboard.
- Description: Optional.
- Folder: Select Select Folder to choose the location where the dashboard should be saved.
- Select Create.
- Select + Component to add a component to the dashboard builder.
- In the Select Report pop-up, find and select the Salesforce report that will be used as the source for the component, and then select Select.
- In the Add Component pop-up, select one of the component types in the Display As section.
You can also choose a variety of visual options for the dashboard component, including swapping the Y-axis and X-axis or choosing between a light theme and a dark theme. Each change that is made is instantly available to review in the Preview window.
- Select Add.
- Select and drag the component around the dashboard builder to change its positioning. Adjust the size by dragging its edges.
- Select the pencil icon at the top-right corner of any component to edit the component, or the X to remove the component from the dashboard.
- Repeat steps 3-7 to add more components to the dashboard. A single dashboard can have up to 20 components.
- Select Save.
The dashboard will now appear in the Salesforce Dashboards tab in the selected folder.
Salesforce Classic instructions
To create a Salesforce dashboard, complete the following steps:
- Go to the Salesforce Reports tab and select New Dashboard....
- In the preview pane of the dashboard builder, select the X at the top of each column to remove the column.
- If column(s) have been removed, select the + icon to add a column back. Salesforce dashboards can have a maximum of three columns.
- In the left-hand side menu bar, select the Components tab and then select and drag dashboard components into the dashboard builder. A single dashboard can have up to 20 components.
- Select and drag the top name bar of any component to move a component around the dashboard.
- In the left-hand side menu bar, select the Data Sources tab and then select and drag Salesforce reports to fill each of the components in the dashboard builder.
- Select the My sub-tab to view only your personal Salesforce reports.
- At the top-left of each of the dashboard columns, select the size dropdown and select either Narrow, Medium, or Wide to change the size of the column. Changing the column size impacts the information that can be displayed in each dashboard component.
- At the top of the dashboard builder, select the Select to enter a dashboard description. field to enter a description that will appear at the top of the dashboard.
- At any point, select the top-right wrench icon of each component to open the Component Editor. Here, you can edit how the information in the component is displayed, with each change made available in the preview window.
- The Component Editor can also be used to change the component type (for example, changing a Horizontal Bar Chart to a Vertical Bar Chart).
- Select Save.
- In the Save Dashboard pop-up, enter the following information and then select Save again:
- Title: Enter a name for the dashboard.
- Dashboard Unique Name: This field auto-populates.
- Save to: Select the location where the dashboard should be saved.
The dashboard will now appear in the Salesforce Dashboards tab in the selected folder.