The Profile Activity tab collects several types of traffic analytics measuring your product’s performance on G2, enabling you to track activity changes over time, compare your product's G2 traffic to your competitors, and assess G2 impact.
To access profile activity, go to my.G2, then Analytics > Profile Activity.
Basics of Profile Activity
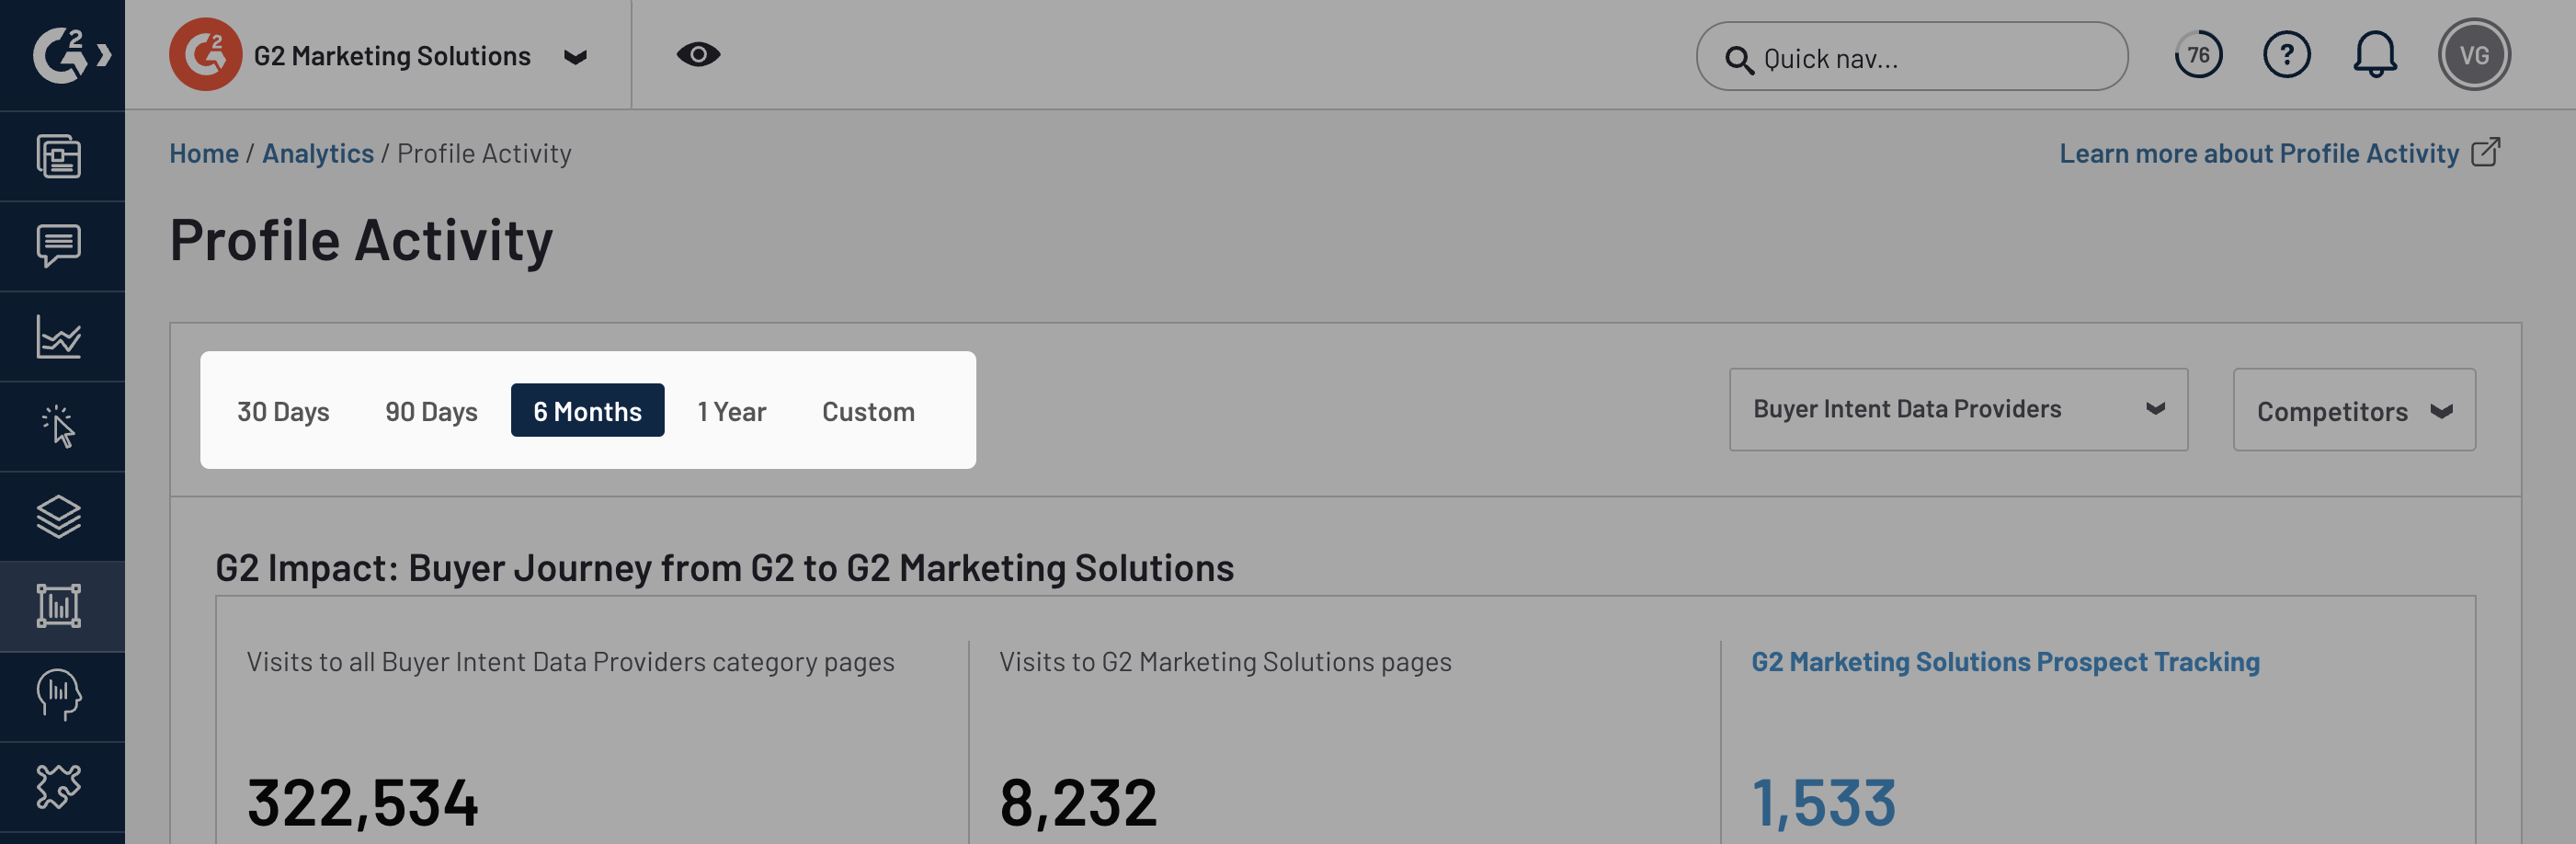
To get started with Profile Activity, use the filter panel to select a default time interval or enter a Custom date range.
You can also use the category dropdown to modify the data in the G2 Impact chart, or search for and select products from the Competitors dropdown to layer competitor data onto the Total pageviews, Compare pageviews, Time on page, and Reviews taken charts.
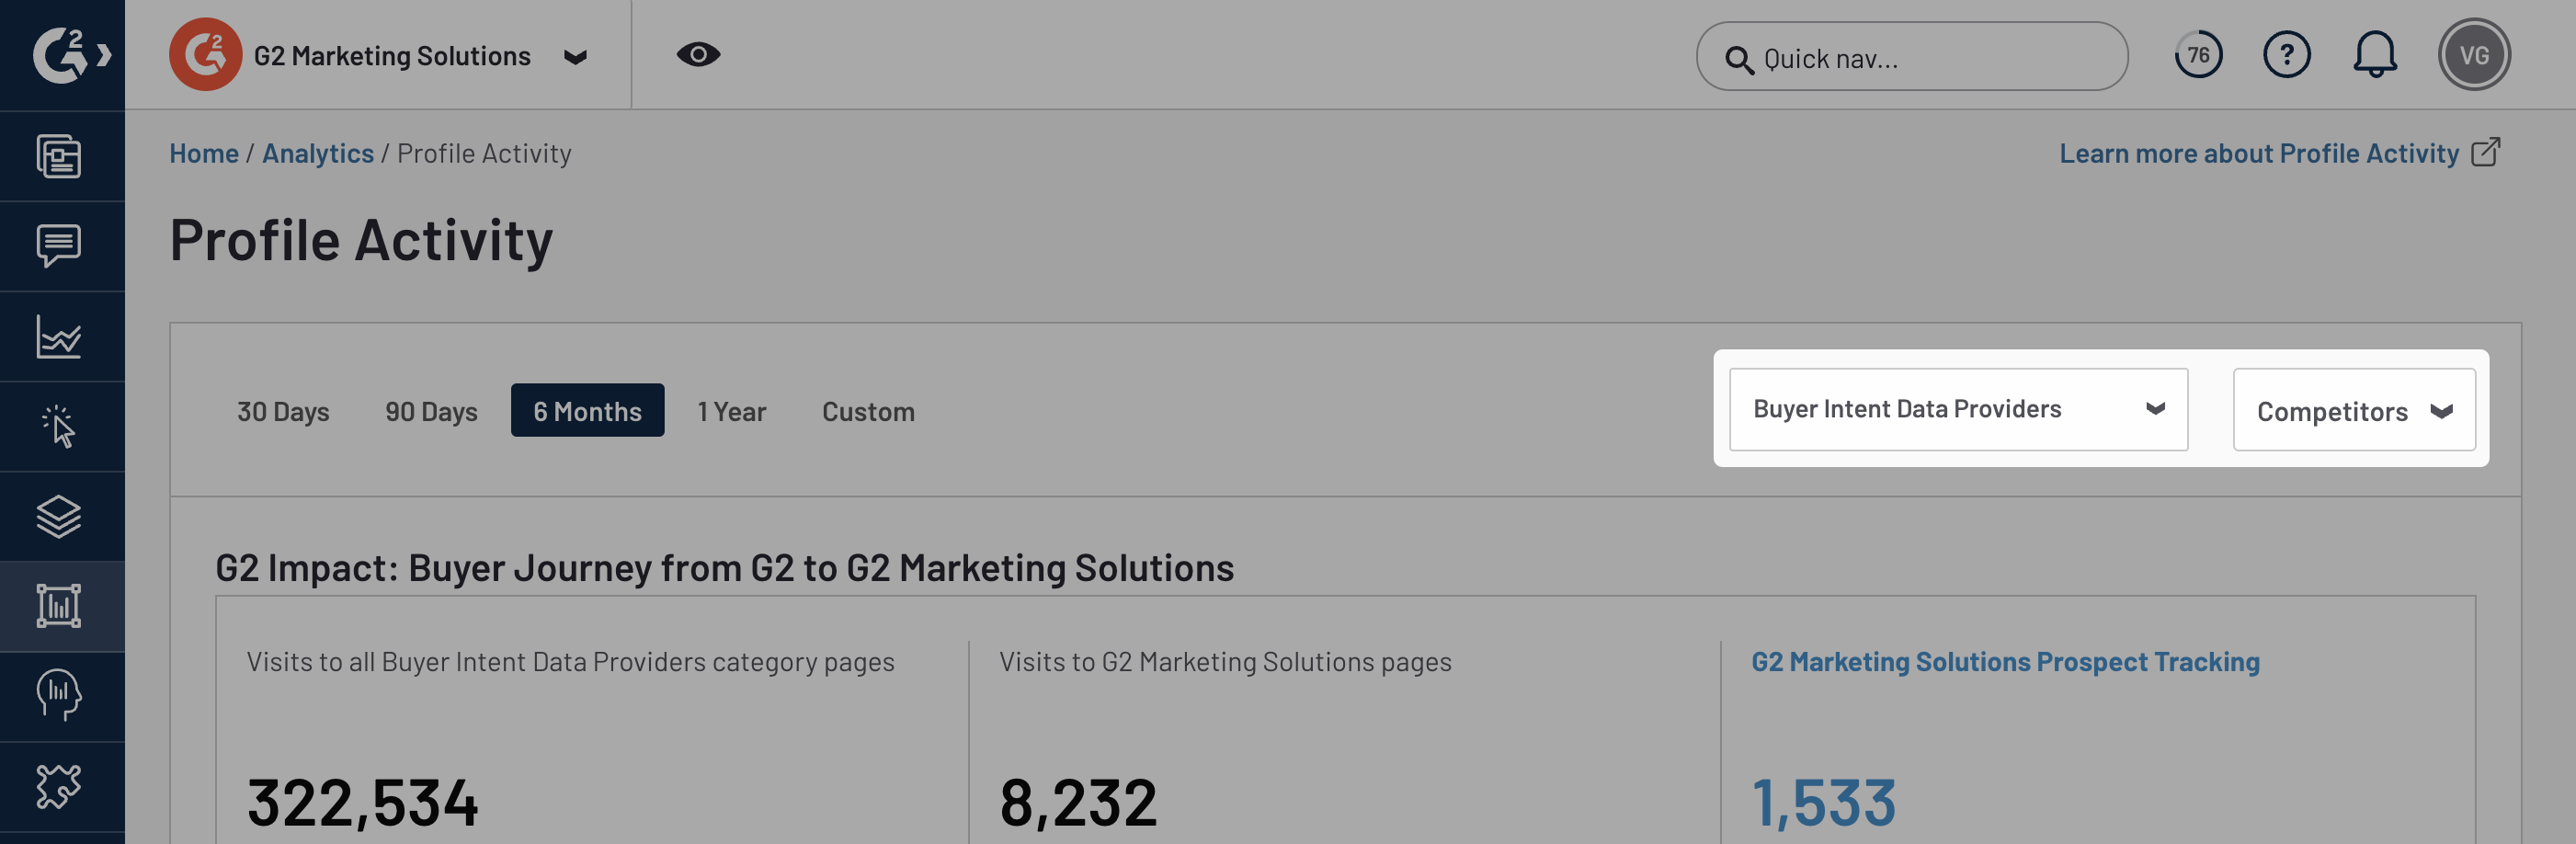
You can add up to three competitors at a time.
Hover over a chart to reveal more detailed information, such as the traffic corresponding to a specific week.
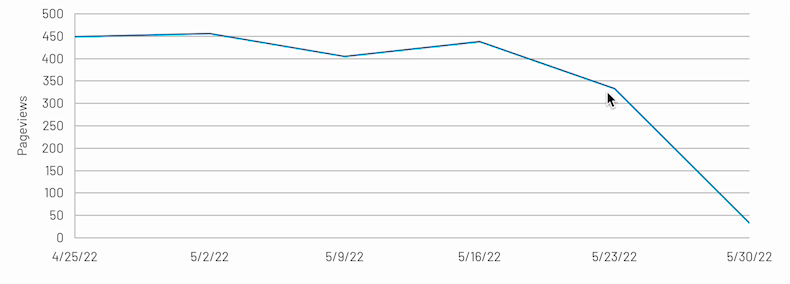
Most Profile Activity charts also contain directional arrows and adjacent percentages indicating how your traffic has changed over time.


To quickly access the traffic data from the previous interval, hover your cursor over the percentage.
The percent change is relative to the timeframe you select. For example, if you select a 30-day timeframe, G2 compares the traffic for the current 30-day interval to the previous 30-day interval. If you select a custom timeframe, G2 calculates the number of days in your timeframe, then compares your timeframe to the same interval preceding your start date.
Activity types
G2 offers the following traffic analytics charts.
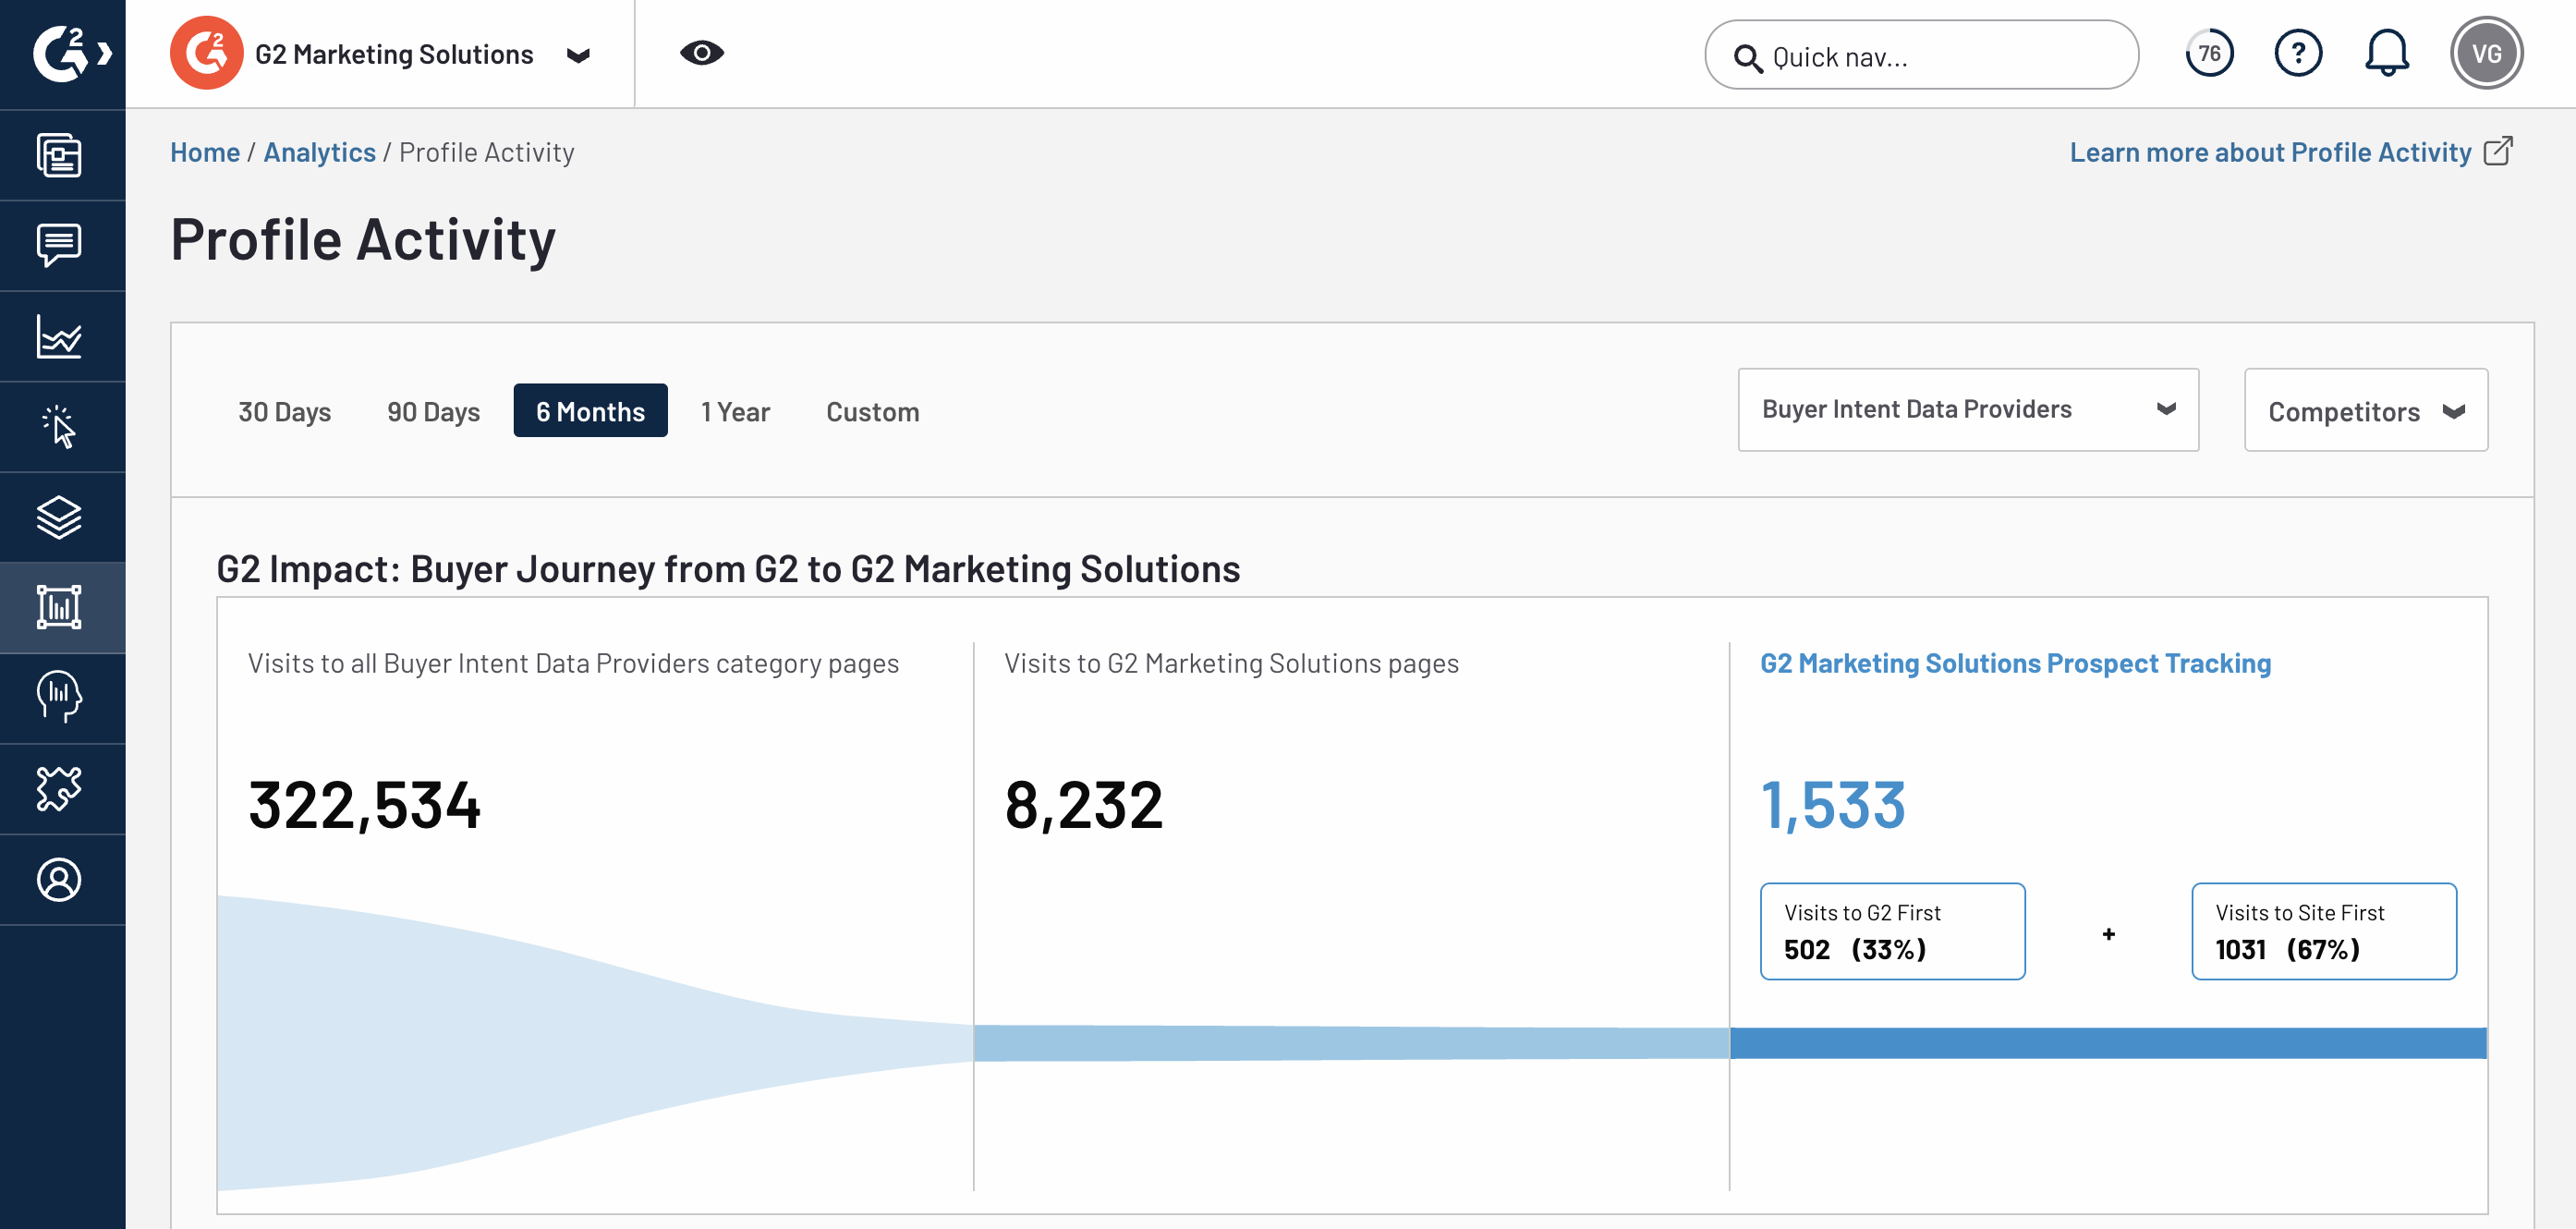
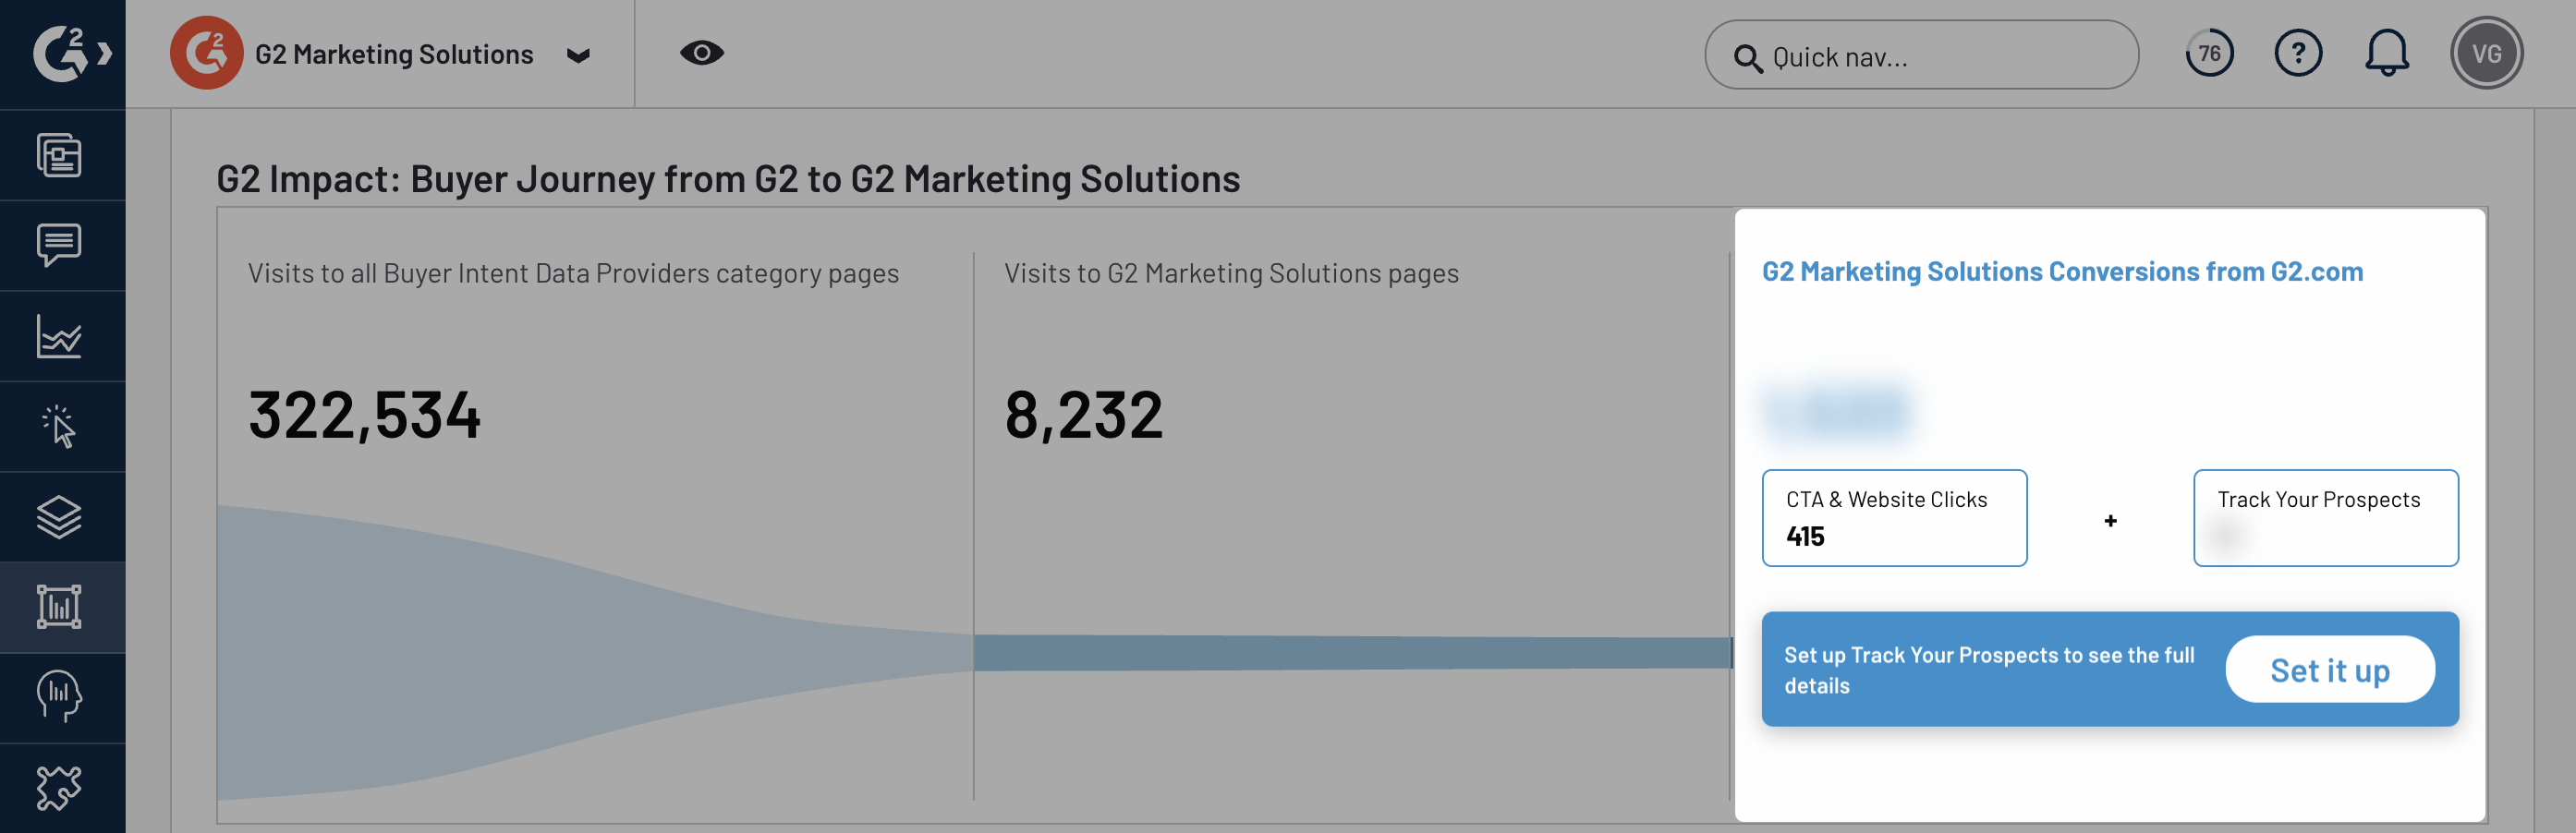
G2 Impact
The G2 Impact chart helps contextualize your product's performance on G2 by providing engagement data for different stages of the buyer journey.
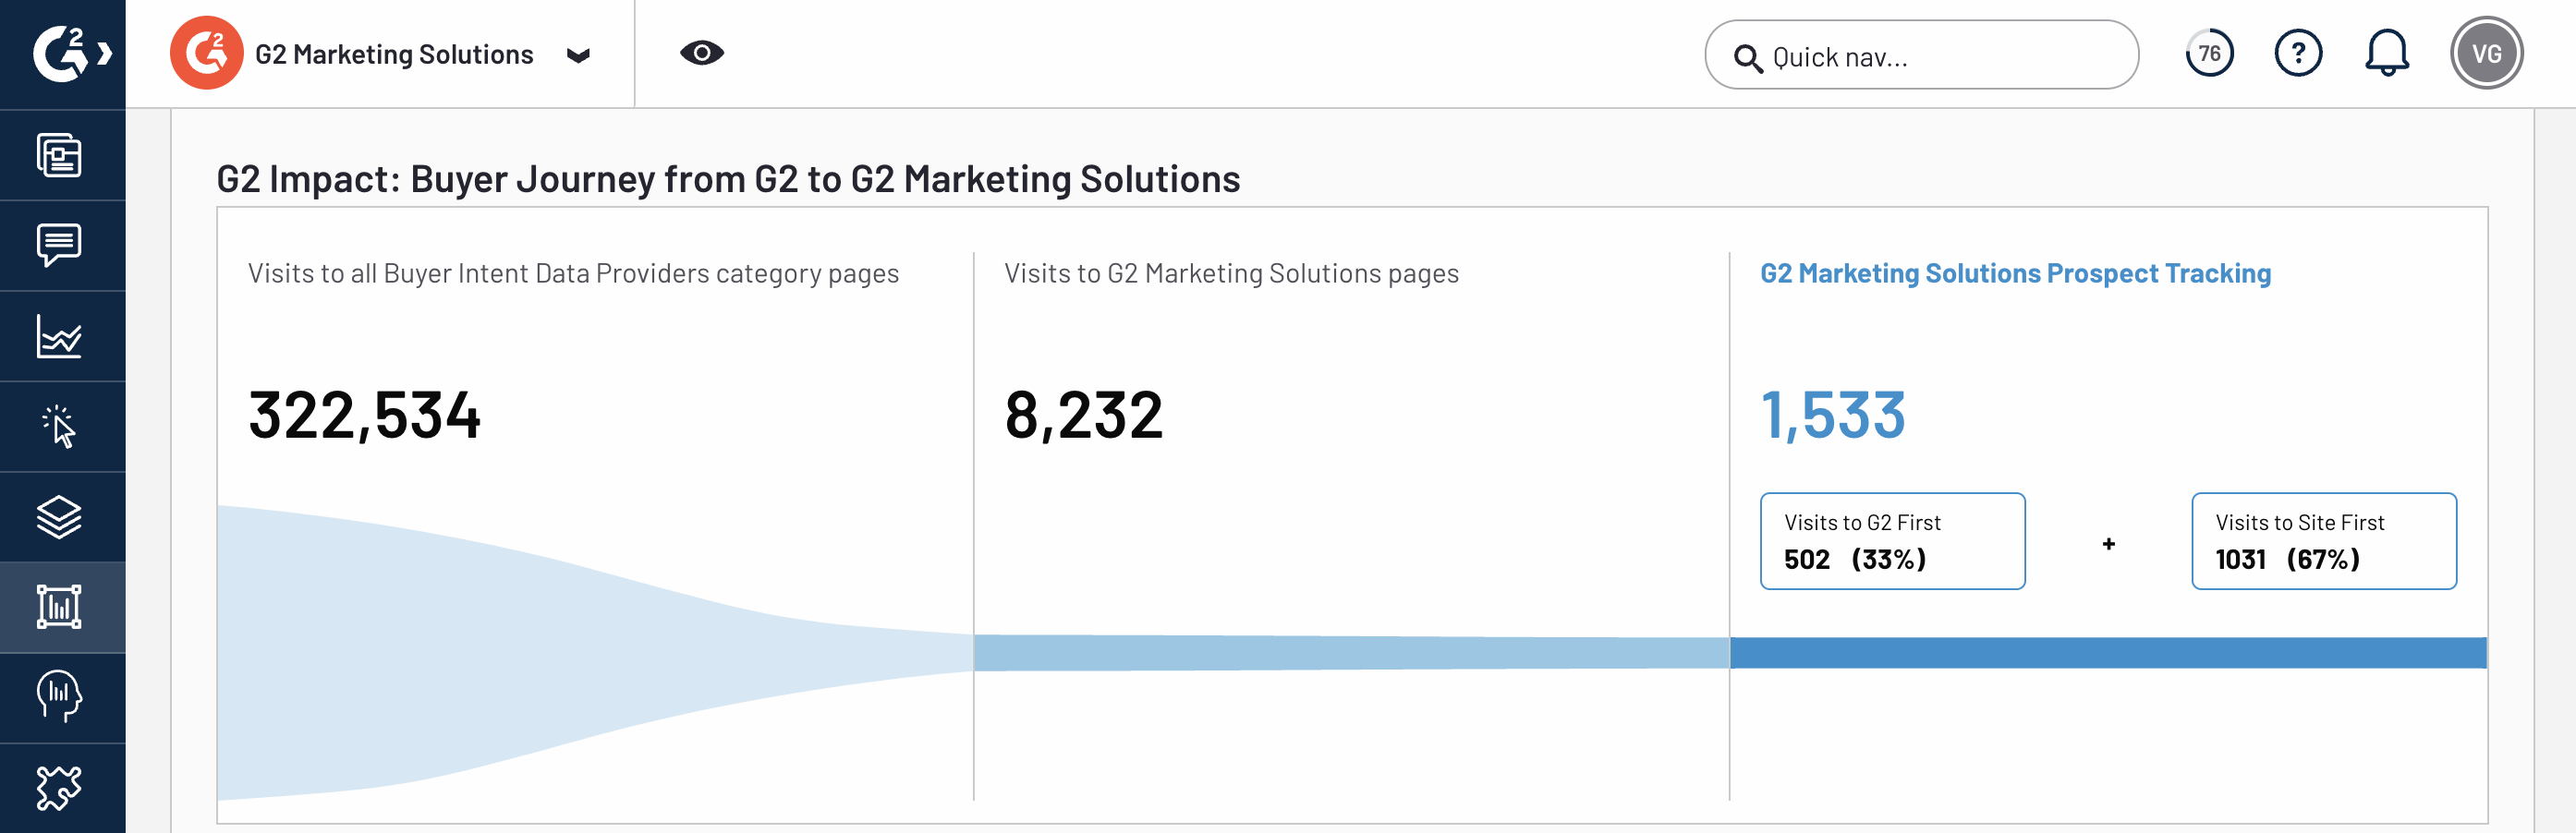
The Visits to all {CATEGORY} category pages panel aggregates the total visits to the category. This includes views of the category page, as well as views of the product profile, comparison, and review response pages for all products within the category.
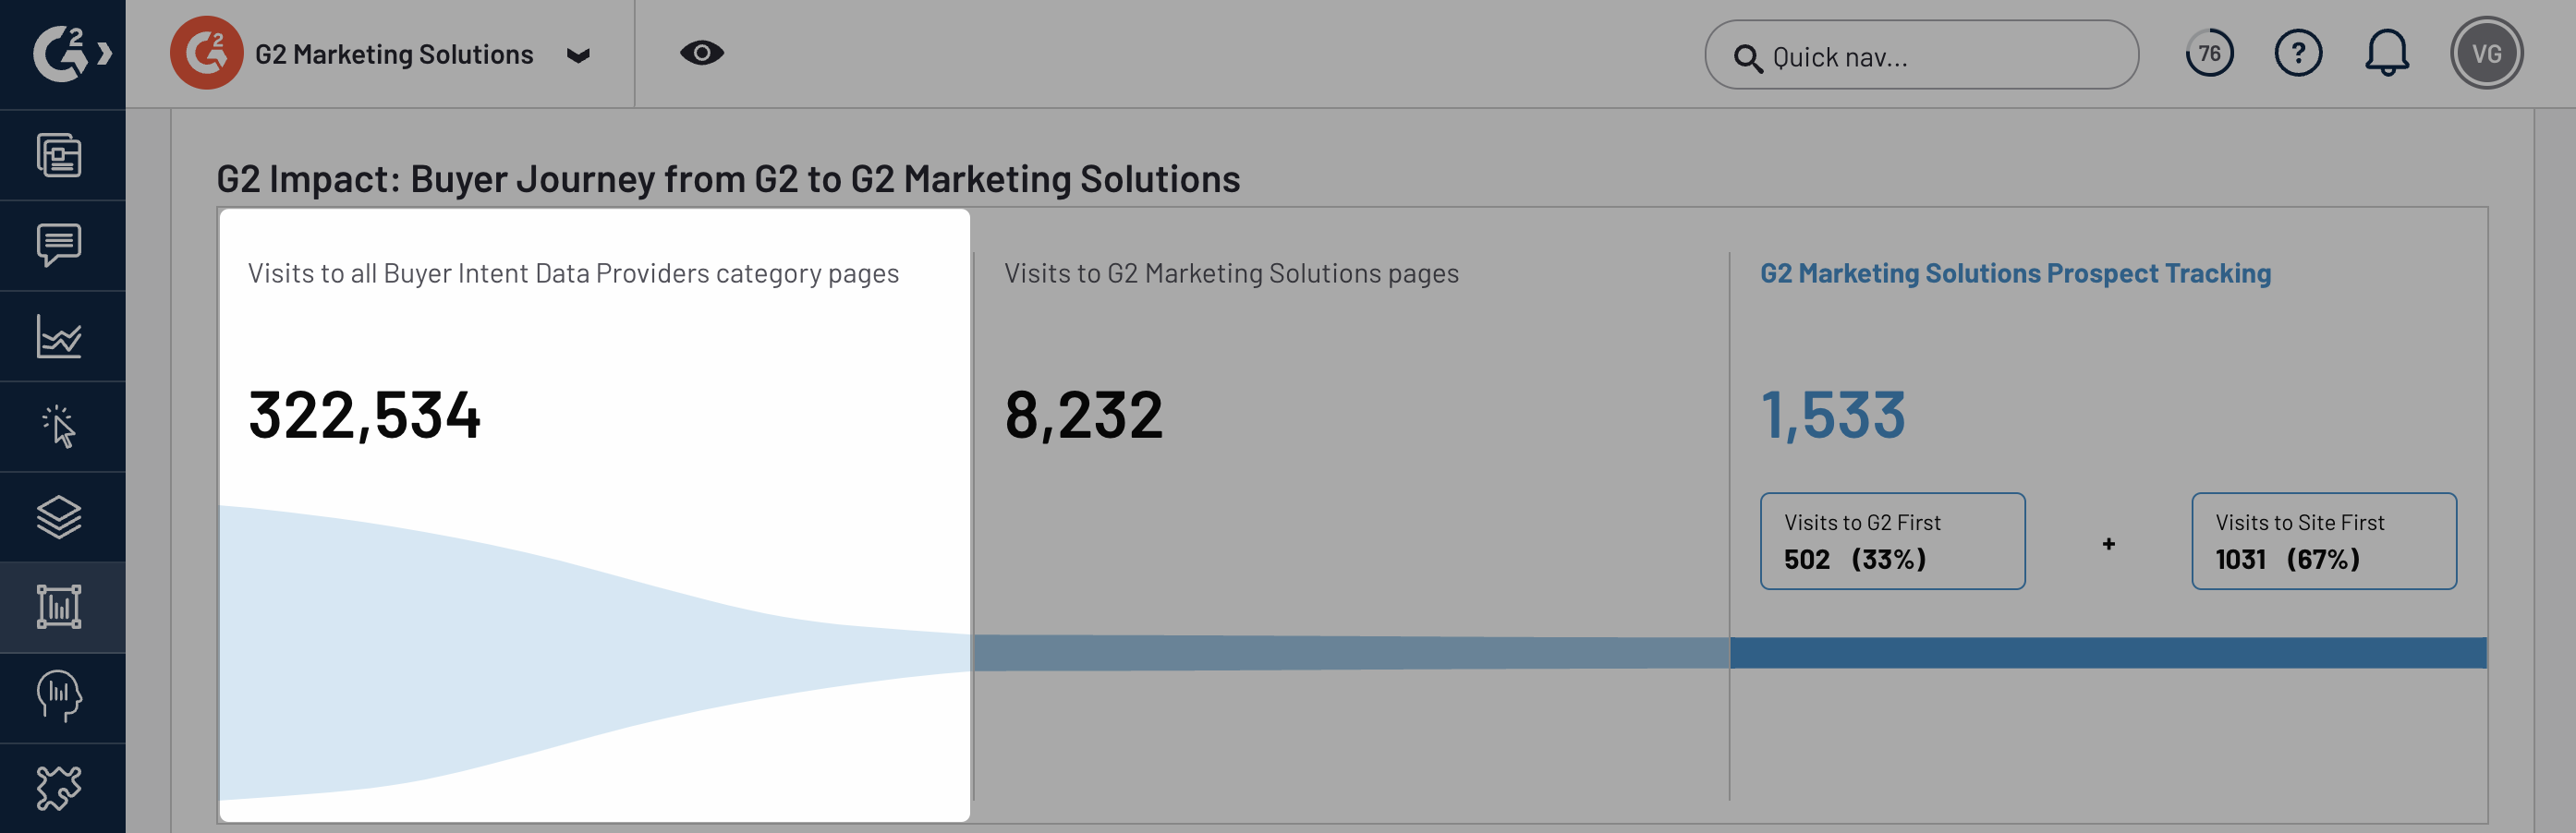
Hover over this panel to reveal data compared to the previous interval.
The Visits to {YOUR PRODUCT} pages panel shows the total visits to your product's pages on G2, including the product profile, comparison, and review response pages.
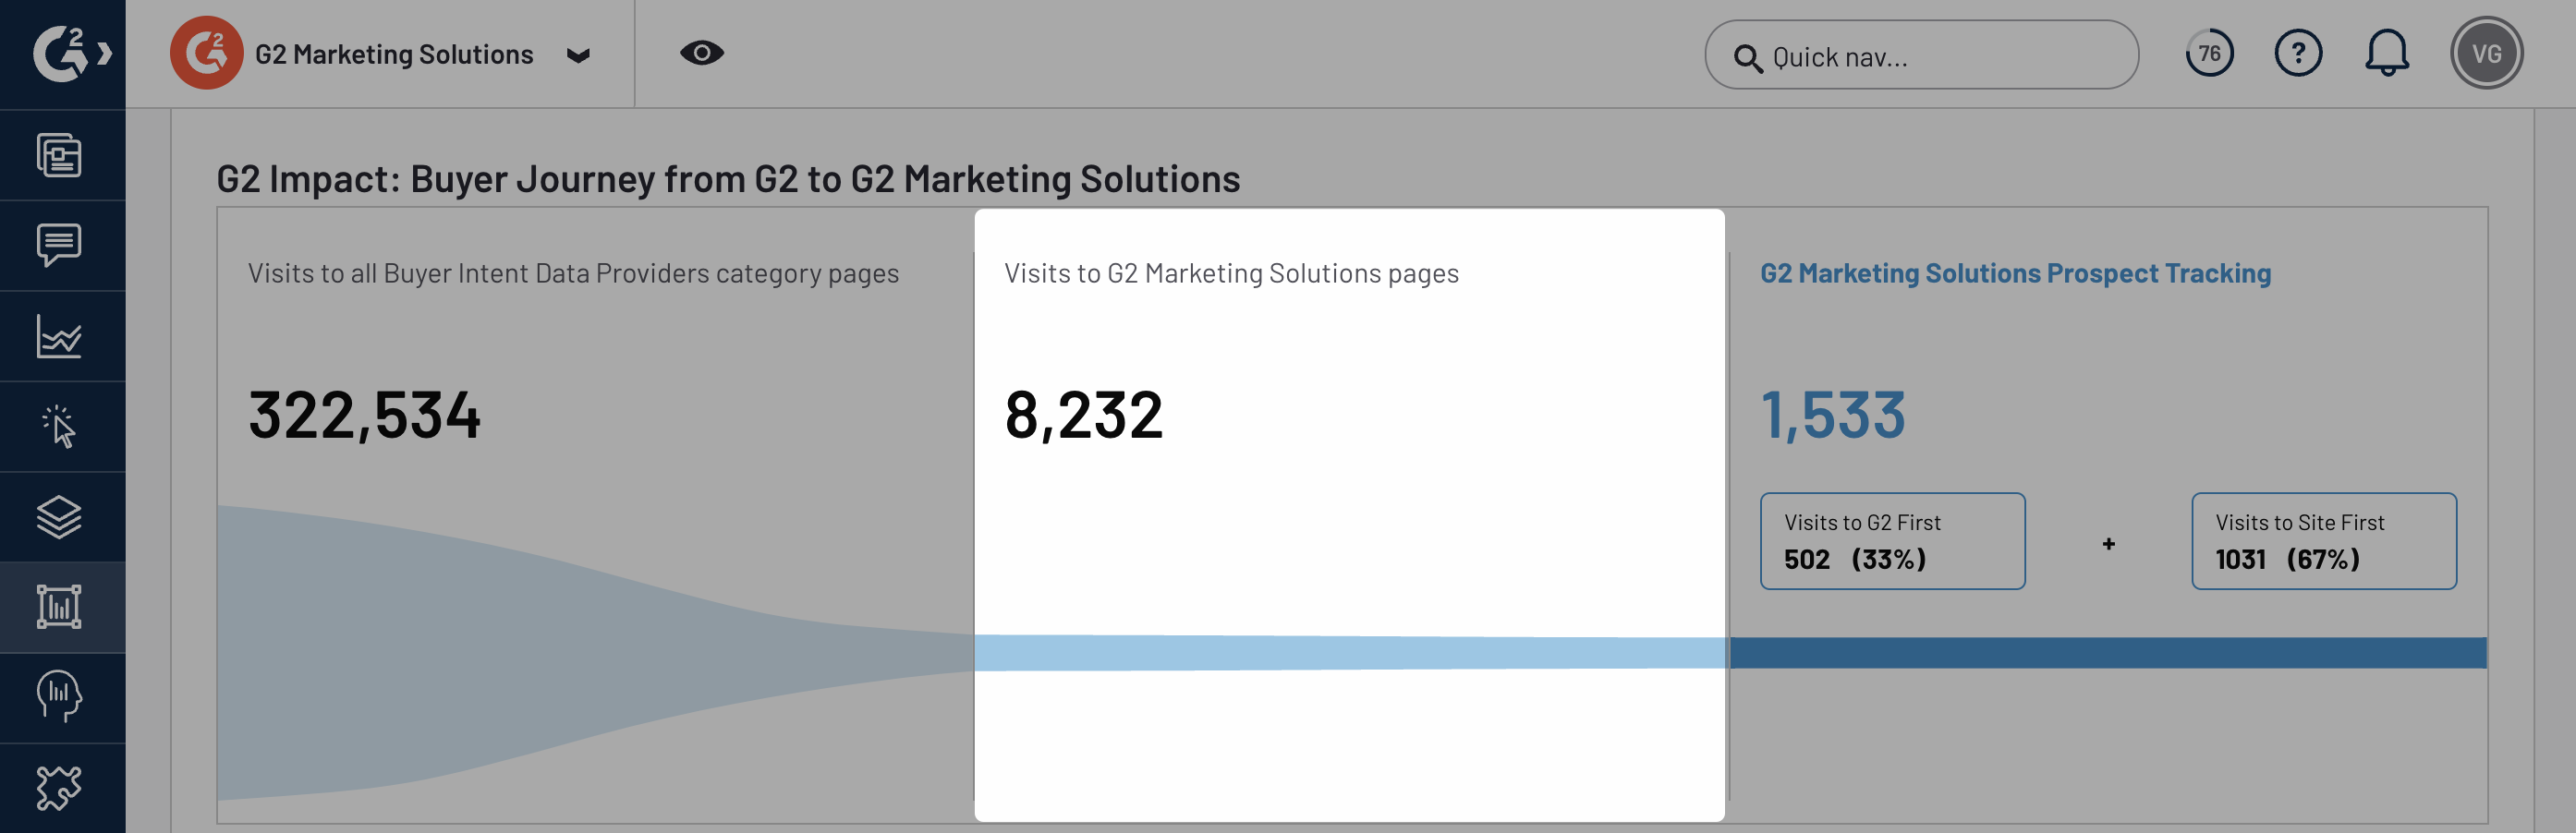
Hover over this panel to reveal data compared to the previous interval, the share of pageviews your product captures relative to the entire category, and the average number of pageviews for products in your category.
The {YOUR PRODUCT} Prospect Tracking panel shows the number of users who navigate between G2 and your website (or vice versa) using Track Your Prospects data.
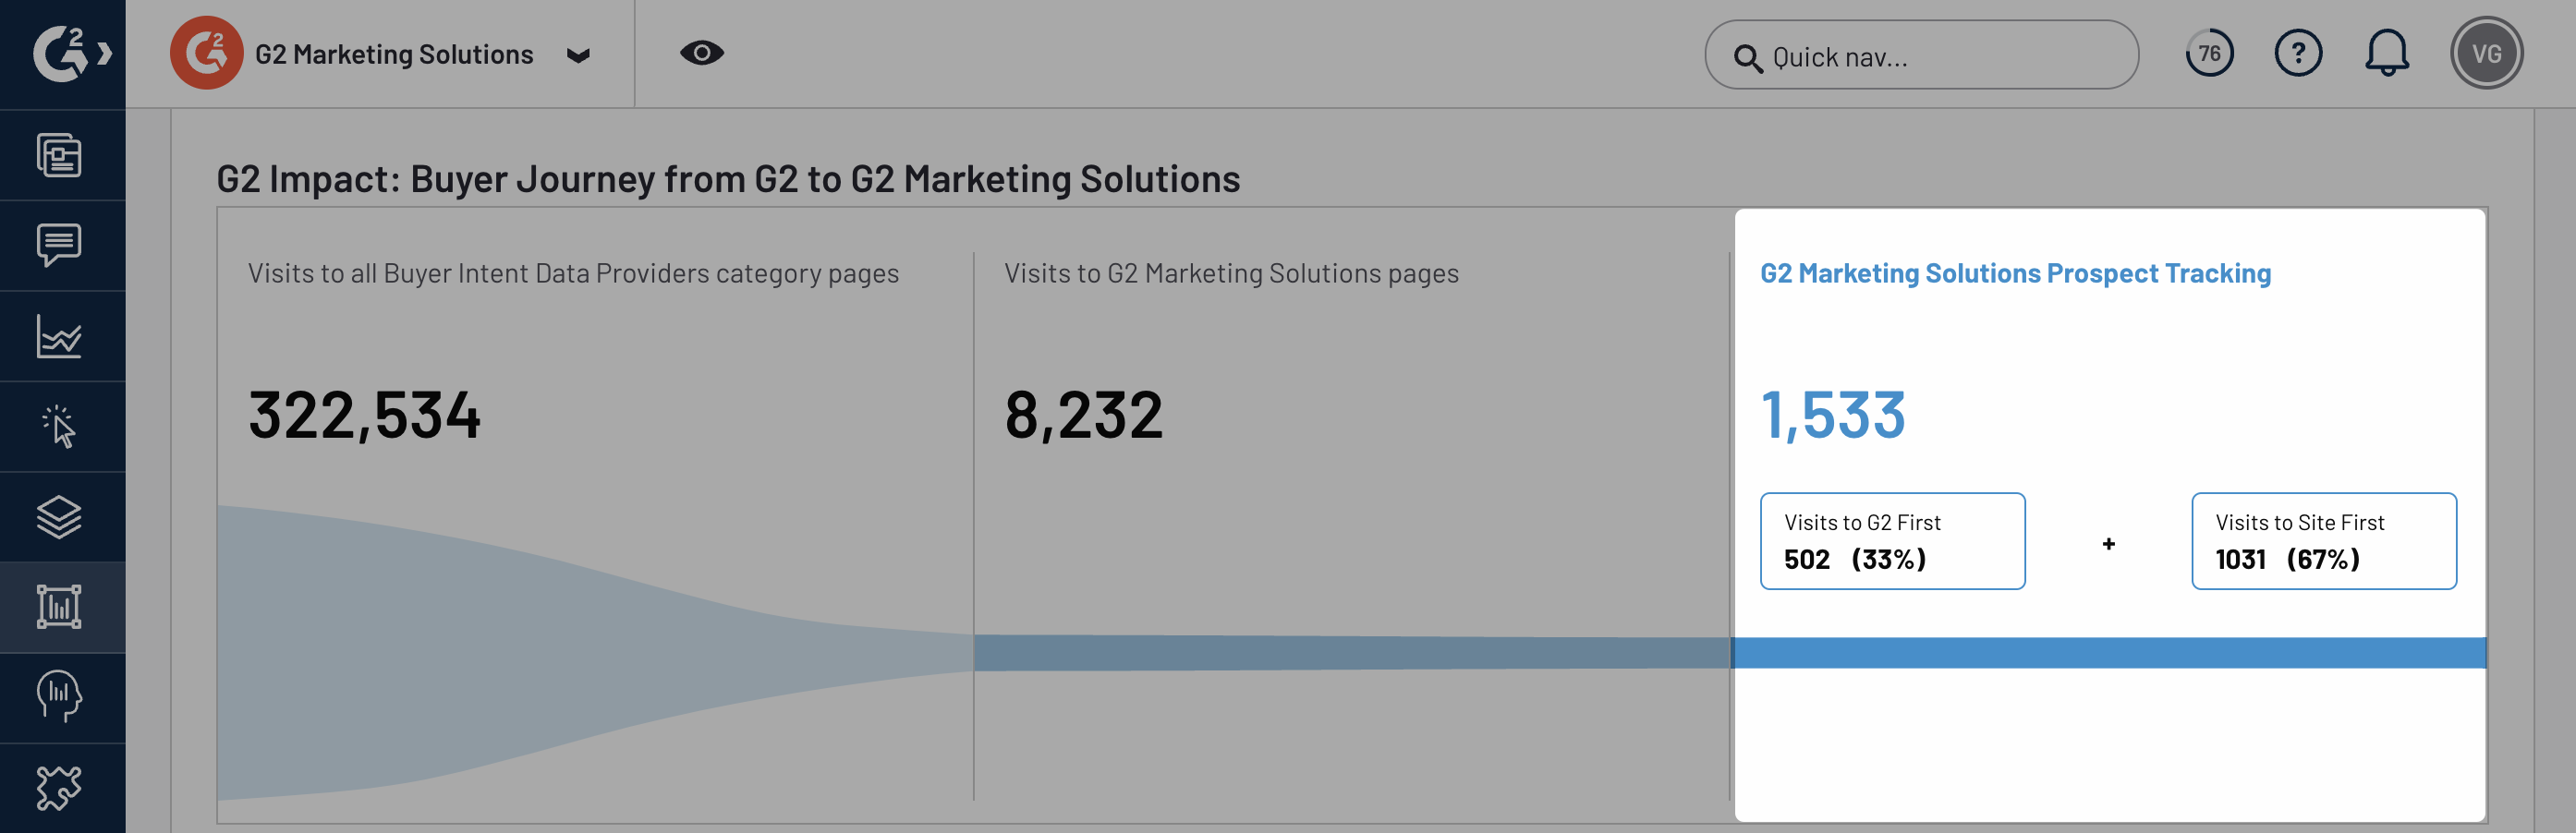
Hover over this panel to reveal data compared to the previous interval, the conversion rate for users navigating between your G2 profile and your website, and the average number of Track Your Prospects for products in your category.
If you do not have Track Your Prospects set up, this panel will show the number of clicks for the CTAs and website links on your G2 profile.
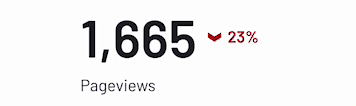
Total pageviews
The Total pageviews chart shows the total number of views for any G2 page that includes your product.
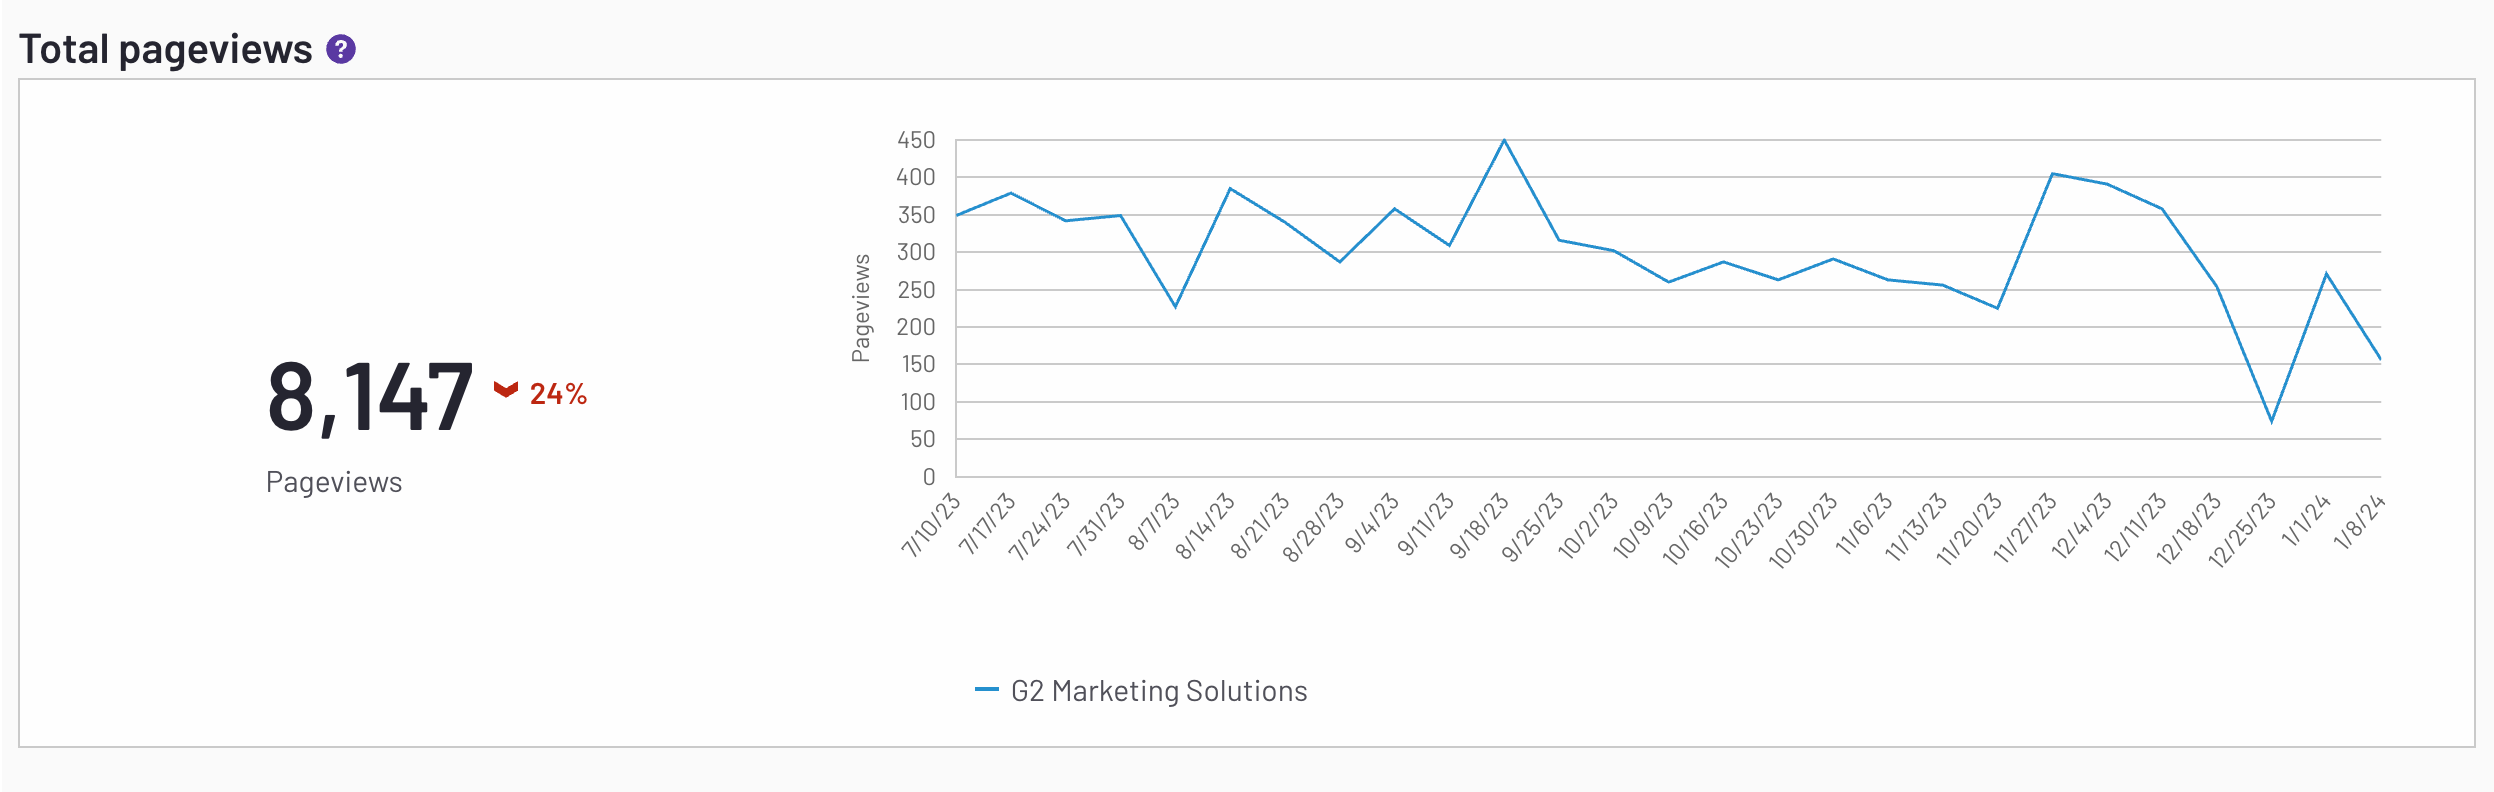
These pageviews include visits to your product profile, Reference Pages, and G2 reviews, as well as G2 category pages and comparison pages that include your product.
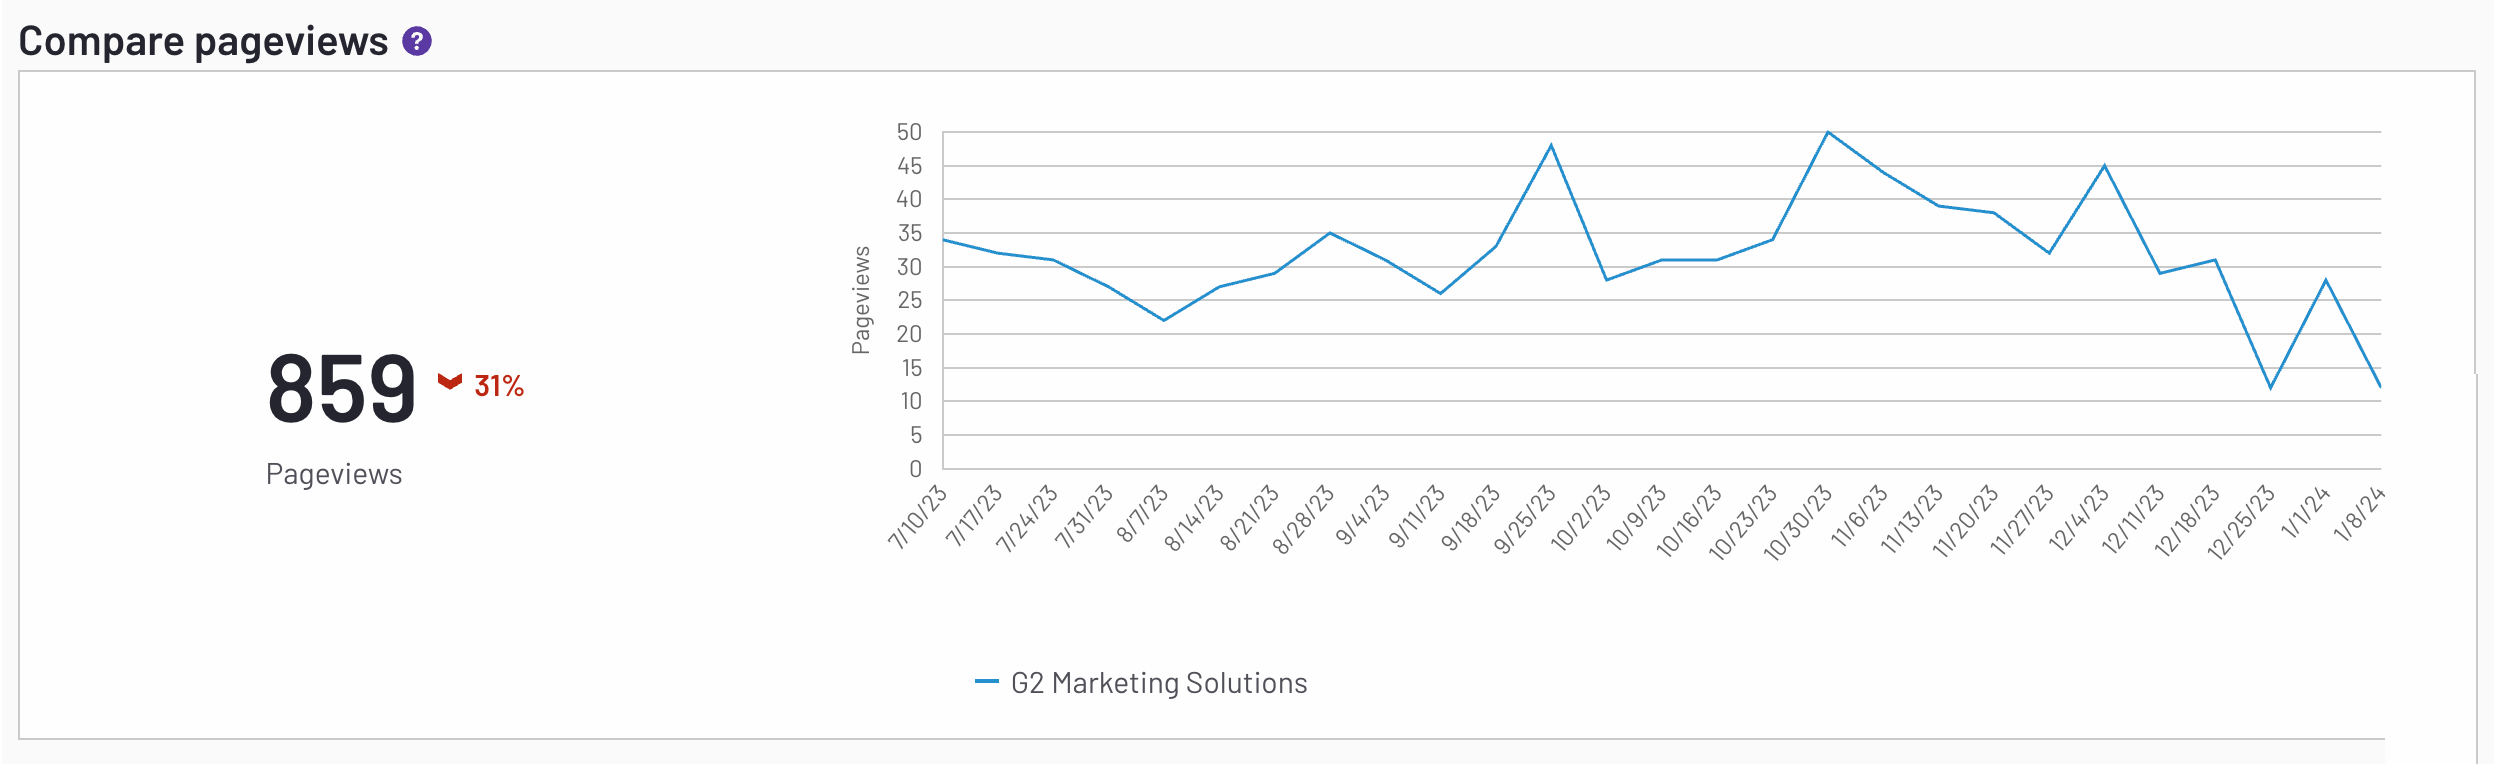
Compare pageviews
The Compare pageviews chart shows the total number of times buyers viewed a G2 comparison page that included your product.
Comparison pages use AI-generated summaries to highlight key differences between products. These summaries are generated by extracting data from comparison pages, which are based on G2 reviews. The data is then converted into a natural-language summary.
Products in the comparison must have at least 10 reviews before a summary will appear. For products with 10 to 28 reviews, the summary updates each time a new review is collected. After both products have at least 28 reviews, the summary is updated monthly, on the first of each month.
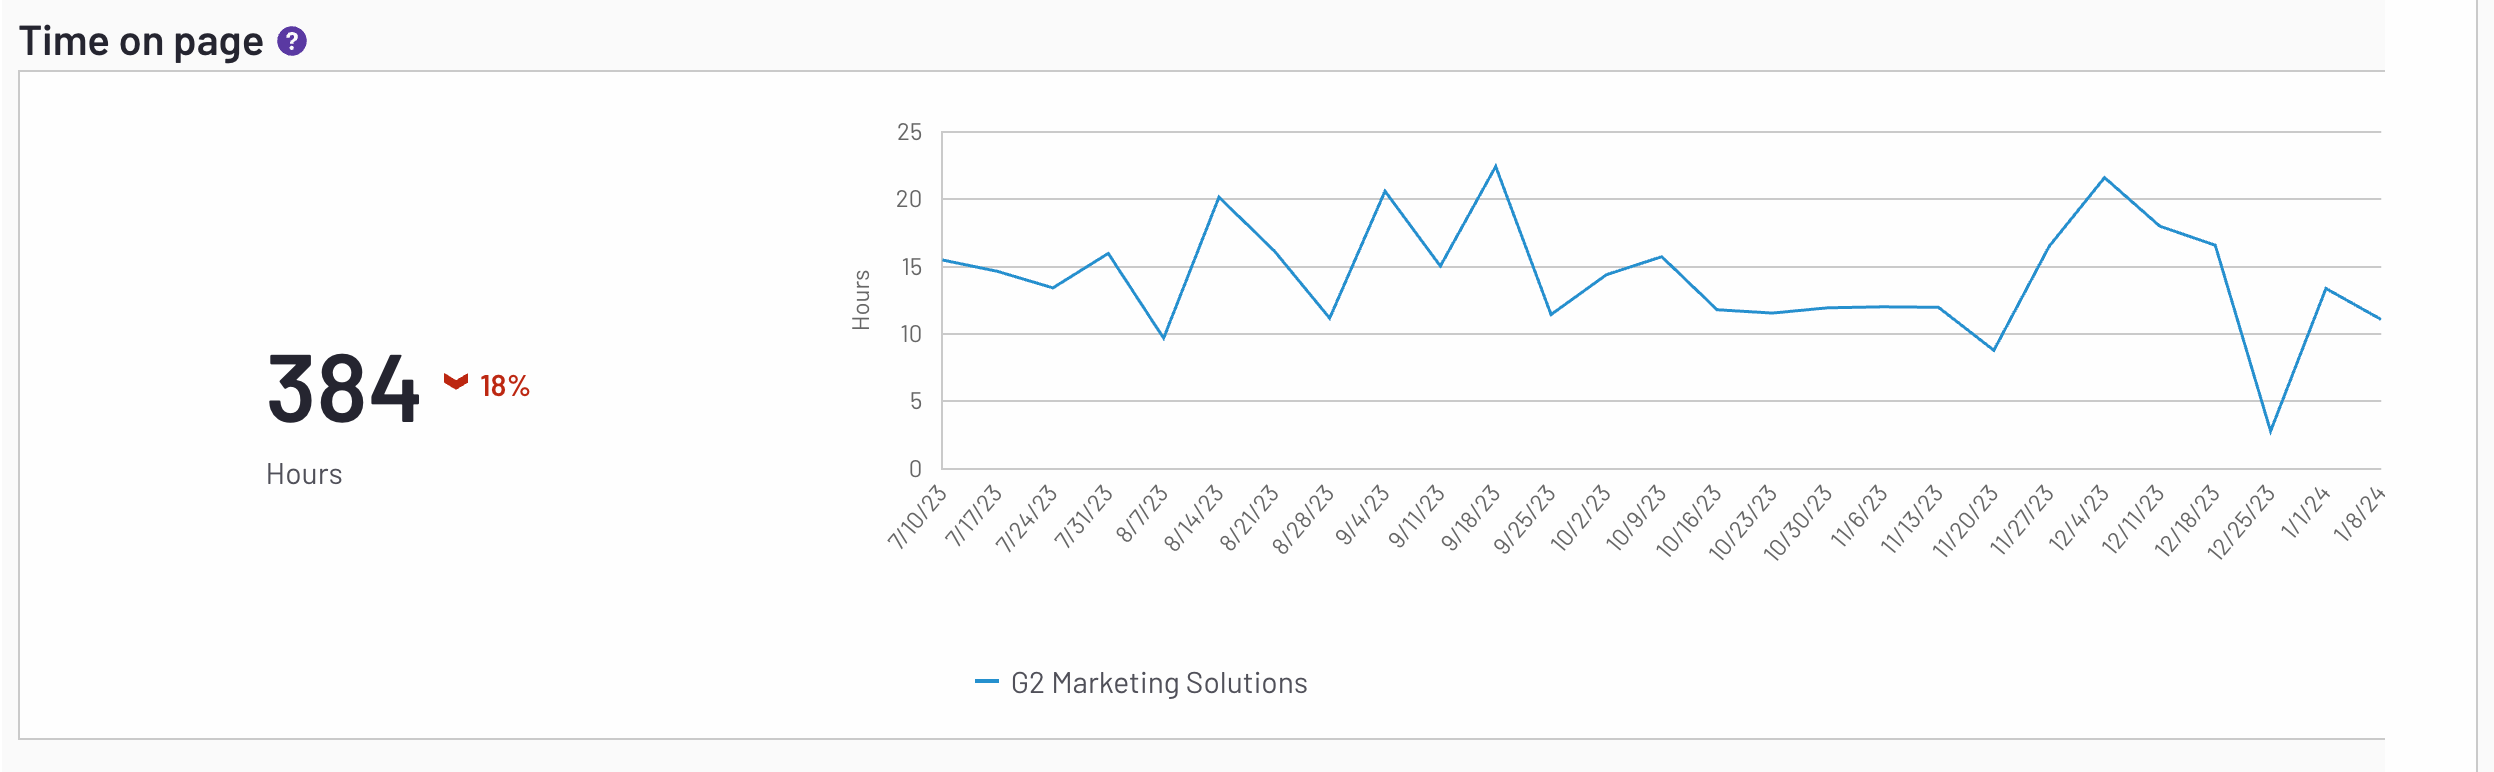
Time on page
The Time on page chart shows the number of hours buyers have spent on your G2 product profile.
Reviews taken
The Reviews taken chart shows the number of G2 reviews published during your selected timeframe.
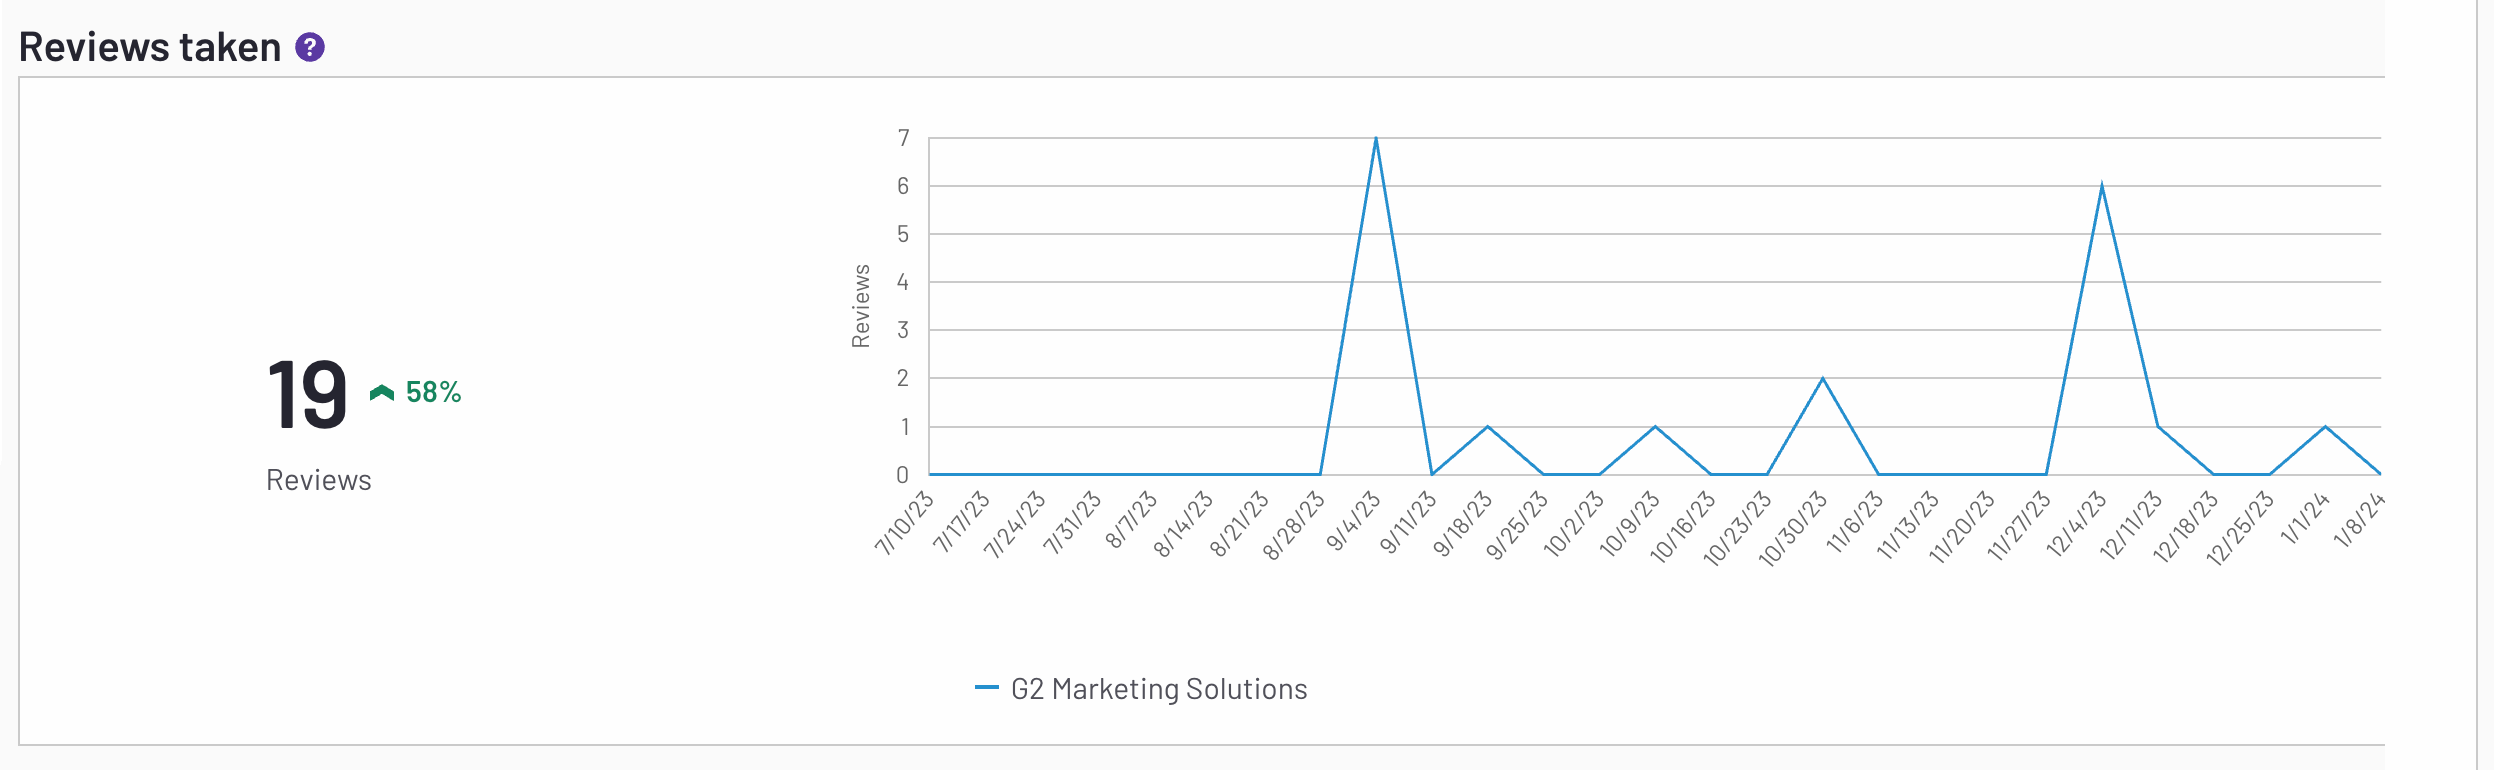
For more information on generating and tracking your reviews, refer to the Review Campaigns and Campaign Dashboard documentation.
Leads submitted
The Leads submitted chart shows the number of leads submitted via your G2 product profile during your selected timeframe.
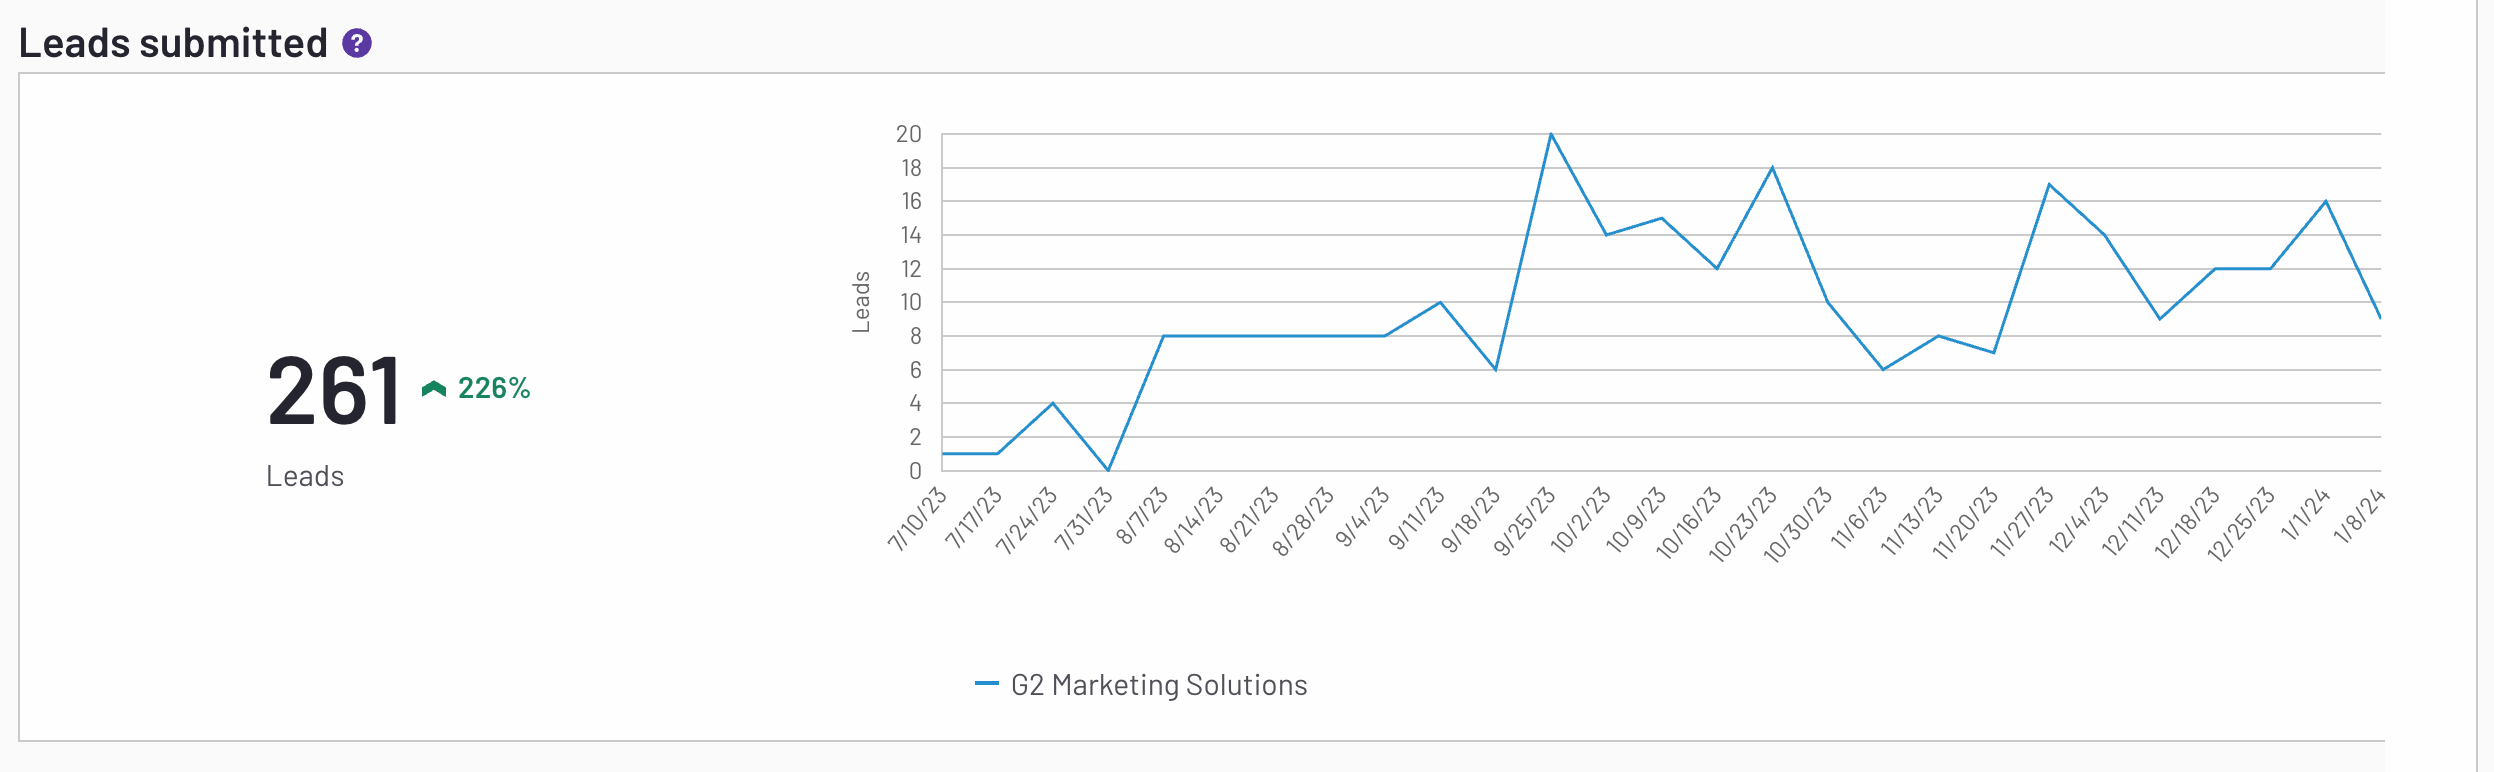
For more information on viewing G2 Leads and configuring your Leads form, refer to the Leads documentation.
CTA / Free trial clicks
The CTA / Free trial clicks chart shows the number of CTA clicks during your selected timeframe.
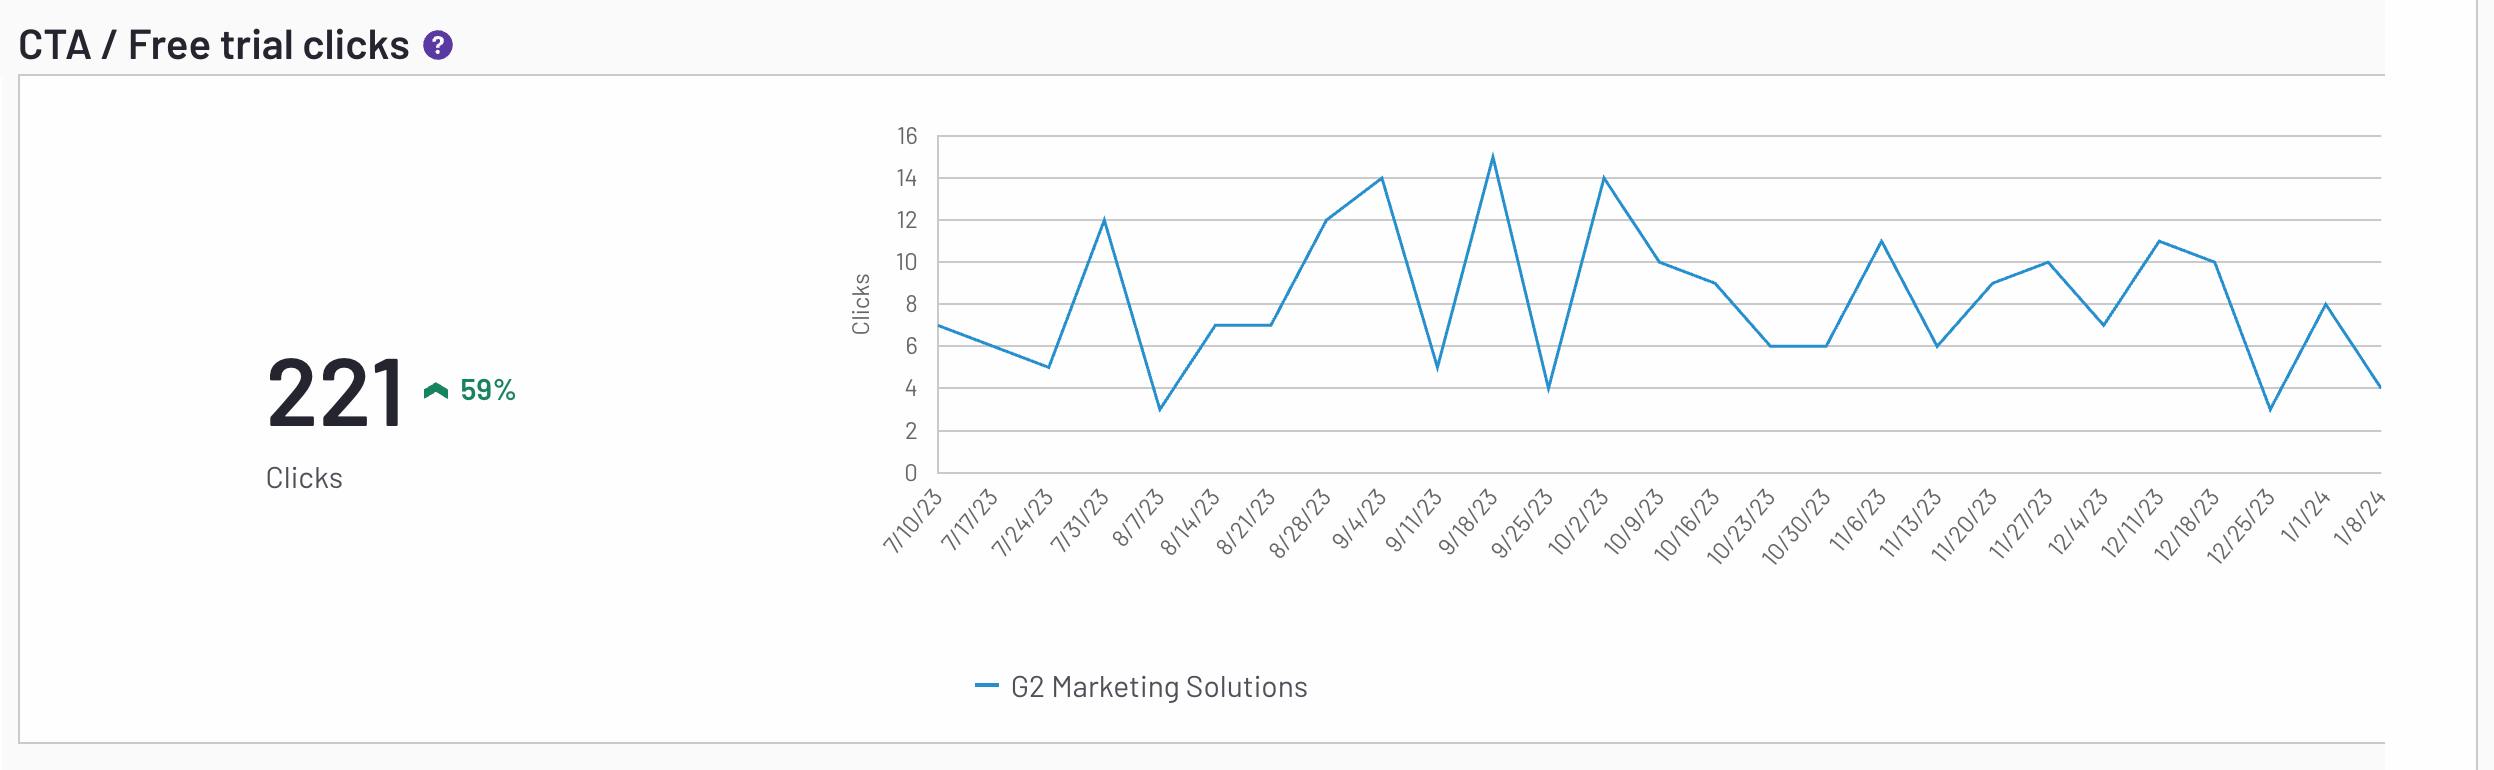
For more information on your G2 product profile CTAs, refer to the CTA settings section of the Leads documentation.
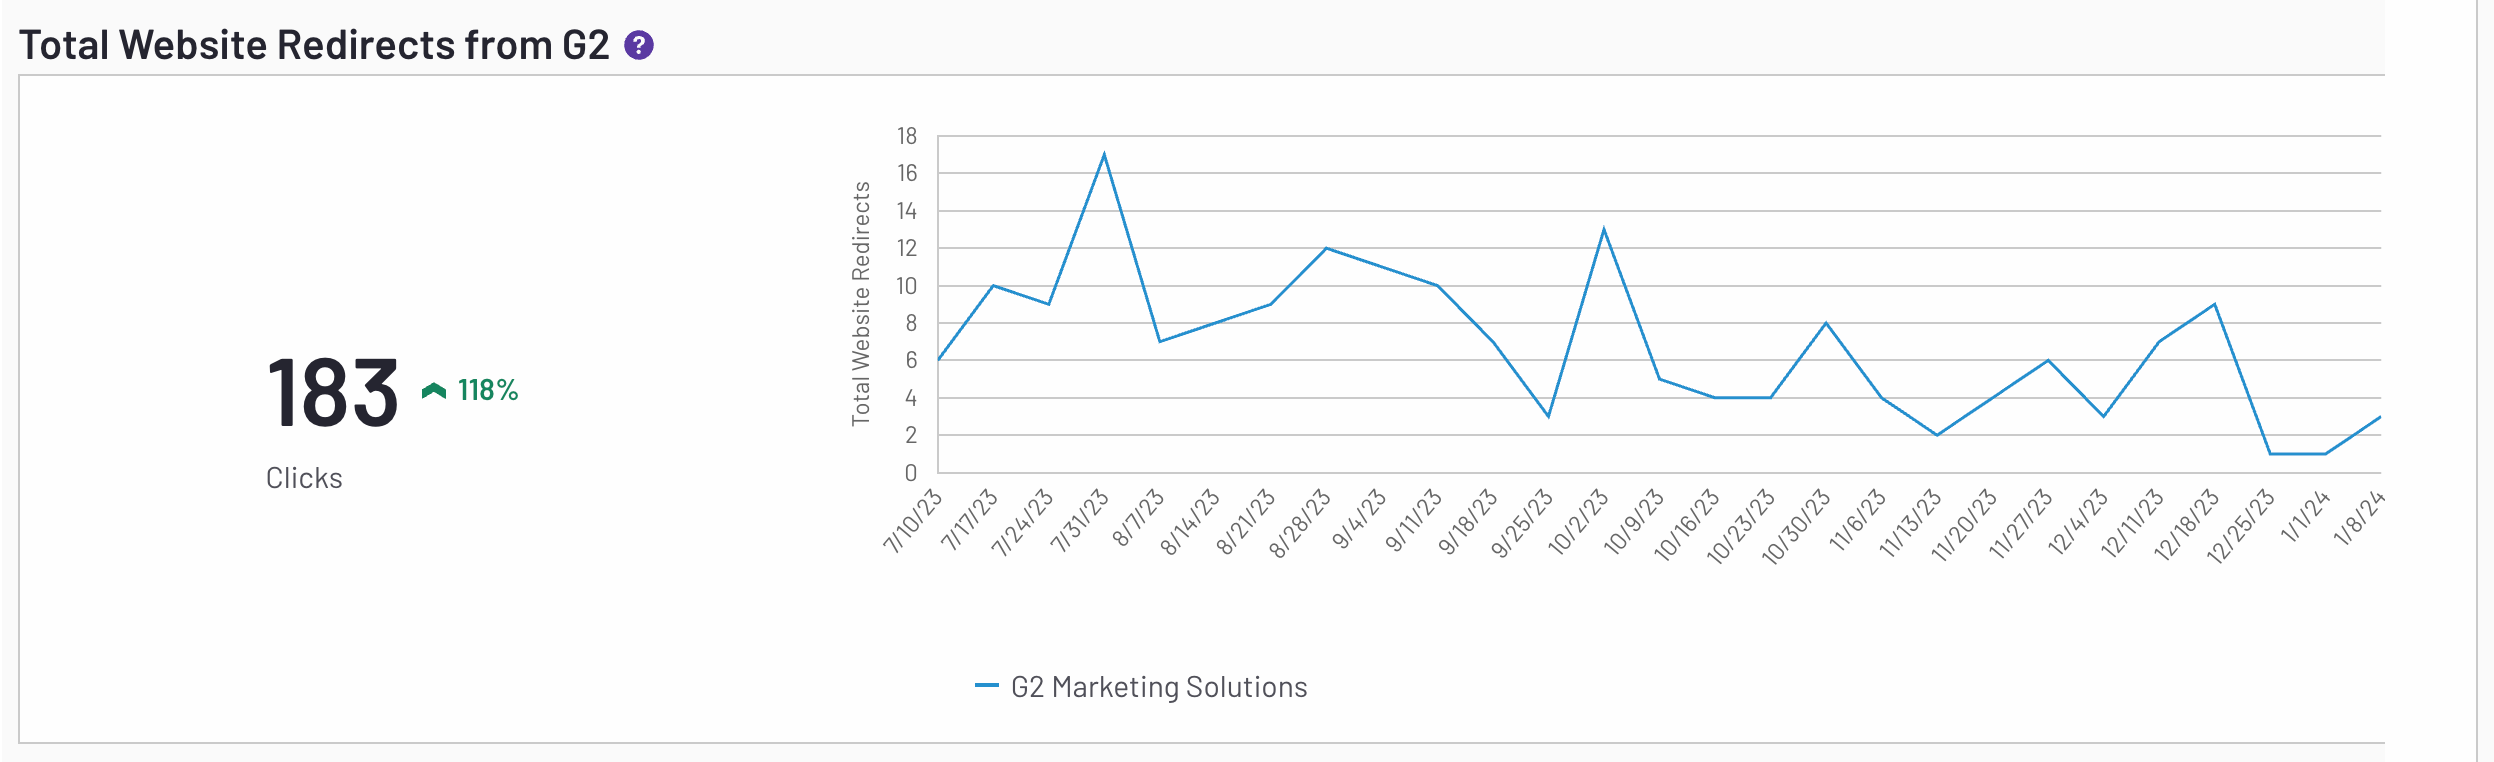
Total Website Redirects from G2
The Total Website Redirects from G2 chart total number of clicks to your website from your G2 product profile.
Profile Activity Trends
The Profile Activity Trends chart plots reviews, clicks, and profile visits into a single view, enabling you to understand how events like the start of a G2-Run Review Campaign and Quarterly Report Release impact these metrics.

By default, G2 displays Profile Activity data for the past six months. To adjust your time interval, select one of the default options.

Hover over a point on the horizontal axis to preview the corresponding chart data, including Profile Visits, Reviews, and Clicks.

Hover over an event on the vertical axis to preview the corresponding event data, including the event type and date.

You can add or remove metrics from your chart by selecting the metric from the key.
